
Micellar Liquid Chromatography
Quick Start
This page accompanies the paper, accepted for publication in Analyst: "Quantifying Non-Specific Interactions via Liquid Chromatography" by Seishi Shimizu, Steven Abbott, Katarzyna Adamska and Adam Voelkel which is linked to the app.
Micellar Liquid Chromatography has been used to characterise micelle/water partition coefficients, Kmw for hydrophobic solutes. Unfortunately, the analysis is based on flawed assumptions. Here we implement the analysis of MLC data using the assumption-free molecular thermodynamics of Kirkwood-Buff Integrals.
Micellar Liquid Chromatography
The standard assumption is that the solute has "a" binding constant with the micelles and that from measurements of retention factor k at different surfactant concentrations, from a plot of 1/k versus surfactant concentration, this binding constant can be derived. That this assumption is flawed is shown by examples of "antibinding" constants. Instead, we plot ln(k) versus concentration. The slope of this curve at any point gives us the Kirkwood-Buff Integral (KBI) value, ΔGu3 along with the excess number of micelles associated with the solute at the given surfactant concentration. Because KBI are directly related to the radial distribution functions, we gain a deep insight into the non-specific binding interactions.
Because there are a lot of Kmw data out there, it is useful to be able to assume that they are just fitting values, from which we can estimate the ΔGu3 values for comparison to those obtained by the correct analysis. For those who have a KM or Kx value from solubility studies, slide Kmw till you see your value and that gives you the correct ΔGu3.
A number of literature datasets are provided for you to compare and contrast - especially by seeing the so-called antibinding examples such as SDS-Ibuprofen which make no sense with standard theory, but perfect sense in terms of KBI.
We are especially grateful to Dr Alina Koneva and colleagues1 at St Petersburg State U. for providing the raw MLC data accompanying their rather full analysis of MLC effects in the context of NMR and light scattering data with a range of solutes and two surfactants.
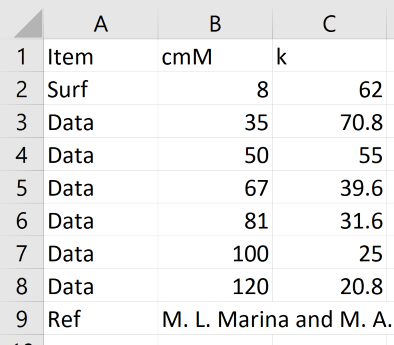 To analyse your own dataset, provide it as an Excel .csv file as per this image. The column headers and row names are case sensitive so have to be exact. The Surf row provides the CMC (mM) and the micellar aggregation number, m. It does not need to be at the top. The Ref row is optional - whatever is in the second column appears in the Ref line in the app. The Data rows (up to 10) hold the surfactant concentration (mM) and k. You can also type values in to the table by hand.
Codes for the examples, where not obvious: pNA: p-nitroaniline, pNP: p-nitrophenol, pNP-CD: p-nitrophenol with α-cyclodextrin; SDS+5: SDS with 5% butanol; Solubilizer: an illustration of the sort of data expected from a good solubilizer such as Tween-20. Note that the Ibuprofen example illustrates what used to be analyzed as "antibinding" but is now simply an excluded volume effect in terms of KB.
1Alina S. Koneva,, Eric Ritter, Yuri A. Anufrikov, Alexey A. Lezov, Anastasiy O. Klestova, Natalia A. Smirnova, Evgenia A. Safonova, Irina Smirnova, Mixed aqueous solutions of nonionic surfactants Brij 35/Triton X-100: Micellar properties, solutes' partitioning from micellar liquid chromatography and modelling with COSMOmic, Colloids and Surfaces A 538 (2018) 45–55