
Coffee Fermentation
Quick Start
Take some fresh coffee berries and, to various extents, remove the outer surfaces, place them into water with ambient or added yeasts ... and the aroma molecules inside the bean will change with time.
Credits
This app is a private draft for Dr Anja Rahn's Curious About Coffee. It is based on the MTER-DFORB equation from Hadj Salem et al1
Coffee Fermentation
//One universal basic required here to get things going once loaded
window.onload = function () {
    //restoreDefaultValues(); //Un-comment this if you want to start with defaults
    Main();
};
//Any global variables go here


//Main is hard wired as THE place to start calculating when input changes
//It does no calculations itself, it merely sets them up, sends off variables, gets results and, if necessary, plots them.
function Main() {
    saveSettings();

    //Send all the inputs as a structured object
    //If you need to convert to, say, SI units, do it here!
    const inputs = {
        mgpg: sliders.Slidemgpg.value,
        V: sliders.SlideV.value,
        L: sliders.SlideL.value/100, //% to fraction
        B: sliders.SlideB.value,
        K1: sliders.SlideK1.value,
        K2: sliders.SlideK2.value,
        P: sliders.SlideP.value,
        kd: sliders.Slidekd.value,
        G: sliders.SlideG.value,
     }

    //Get all the resonses as a structure
    const result = CalcIt(inputs)

    //Set all the text box outputs
 //   document.getElementById('TgWet').value = result.TgWet
    if (result.plots) {
        for (let i = 0; i < result.plots.length; i++) {
            plotIt(result.plots[i], result.canvas[i]);
        }
    }

}

//Here's the real app calculation
function CalcIt({mgpg, V, L, B, K1, K2, P, kd, G}) {
    //The structure automatically has the names provided from input
    //By convention the values are provided with the correct units within CalcIt
    let BPts=[], OPts=[], C=0
    // const tstep=1
    // for (let t = 0; t <= 48; t+=tstep) {
    //     C=mgpg*L*(1+(V+1)*B/mgpg-Math.exp(-(K1*Math.exp(P*t)+K2)*(t*(V+1))))/(V+1)*(Math.exp(-kd*t))
    //       BPts.push({x:t,y:C})
    // }
    const tstep=0.1
    const cInc=G/V*tstep
    let cOut=mgpg/V, cIn=B, Diff=0, K1P=K1, Lost=0
    for (let t = 0; t <= 48; t+=tstep) {
        OPts.push({x:t,y:cOut*V})
        BPts.push({x:t,y:cIn})
        K1P=K1*Math.exp(P*t)
        Diff=(L*cOut-cIn)*tstep*(K1P+K2)
        cOut += (cInc - Diff)
        Lost = kd*tstep*cIn
        cIn += (Diff - Lost)
    }

    //Now we return everything - text boxes, plot and the name of the canvas, which is 'canvas' for a single plot
    const prmap = {
        plotData: [BPts,OPts], //An array of 1 or more datasets
        lineLabels: ["C in bean","C in ferment"], //An array of labels for each dataset
        hideLegend: false,
        xLabel: 't&hr', //Label for the x axis, with an & to separate the units
        yLabel: 'Ct&mg/g', //Label for the y axis, with an & to separate the units
        y2Label: null, //Label for the y2 axis, null if not needed
        yAxisL1R2: [], //Array to say which axis each dataset goes on. Blank=Left=1
        logX: false, //Is the x-axis in log form?
        xTicks: undefined, //We can define a tick function if we're being fancy
        logY: false, //Is the y-axis in log form?
        yTicks: undefined, //We can define a tick function if we're being fancy
        legendPosition: 'top', //Where we want the legend - top, bottom, left, right
        xMinMax: [,], //Set min and max, e.g. [-10,100], leave one or both blank for auto
        yMinMax: [,], //Set min and max, e.g. [-10,100], leave one or both blank for auto
        y2MinMax: [,], //Set min and max, e.g. [-10,100], leave one or both blank for auto
        xSigFigs: 'P3', //These are the sig figs for the Tooltip readout. A wide choice!
        ySigFigs: 'P3', //F for Fixed, P for Precision, E for exponential

    }
    return {
        plots: [prmap],
        canvas: ['canvas'],
    };
}
 How the published model works
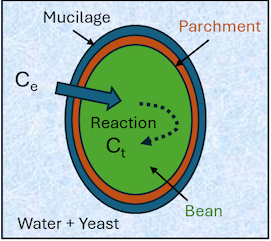
We have a starting external concentration, C0 in mg/g of water of some molecule of interest such as phenylethanol and we want to know the concentration at time t, Ct, inside the bean.
It depends, first, on V, the relative volume of coffee beans to water, `V=V_c/V_w`. If V=1 and if there is no destruction of the molecules inside the bean, the equilibrium value is 50% of the original. For higher values such as the default 1.4, it's lower. Next there is a % of free molecules in the water, L, typically 100% but sometimes adding, say, yeast, can reduce this to 40%.
For those molecules that exist already in the bean we need a starting value B mg/g.
We then have potentially two diffusion coefficients. If we have parchment, then the K1 value is mixed with a time-dependent parchment value, p, which can describe how the parchment gets more resistant (more negative p) over time. If there's no parchment (or if the parchment isn't a barrier to the molecules) then you just use K1 with p = 0 and K2 is set to 0.
Once in the bean, the molecules might be actively destroyed (metabolised) by one or more (enzymic) reactions. Here we assume two reactions with rates kd1 and kd2. The fraction of reaction 1 is g and of reaction 2 is (1-g).
The whole model is called MTER-DFORP, Mass Transfer with Evolving Resistance - Double First Order Reaction in Parallel. You can make it simple MT by setting K2, P, kd1 and kd2 to zero to understand the basics, then add more complexities as needed. Here's the equation:
`C_t=C_0L(1 + ((V+1)B)/C_0-e^(-(K_1e^(pt)+K_2)t(V+1))/(V+1))("g"e^(-k_(d1)t)+(1-g)e^(-k_(d2)t))`
However, for the purposes of the app the benefits of the DFORP are small and it was easy to get confused, so for the app the kd2 term has been removed, along with g, so it's an MTER-FORP equation with a single kd parameter:
`C_t=C_0L(1 + ((V+1)B)/C_0-e^(-(K_1e^(pt)+K_2)t(V+1))/(V+1))(e^(-k_(d)t))`
To replicate the plots in the paper (though they are in %T we are in mg/g), set V = 1.4, L = 1 and S = 0, then use the following values. Values not specified are all 0. See below for the additional G parameter:
- Phenylethanol, no parchment: K1 = 0.041.
- Phenylethanol, with parchment: K1 = 0.031, K2 = 0.008, P = -0.056, with kd = 0.
- Isoamyl acetate, all cases: K1 = 0.003, kd = 0.052, .
- For Butanal: K1 = 0.008, kd = 0.14
Finally, if you add a lot of yeast then Butanal is strongly absorbed and L reduces to 0.4.
An earlier paper2 from the Hadj Salem group provided data on Lactic Acid, Alanine, Glutamic Acid and Fructose. Their data included amounts originally in the beans (0 mg/g for lactic acid, 0.3 for alanine, 0.9 for glutamic acid and 8 for fructose. In each case we have parameters for parchment-free and with parchment and both V and L = 1. Unspecified parameters are all 0. The results with parchment are identical with/without mucilage or fermentation:
- Lactic Acid, no parchment: K1 = 0.036
- Lactic Acid, with parchment: K1 = 0.005
- Alanine, no parchment: B = 0.3, K1 = 0.044
- Alanine, with parchment: B = 0.3 K1 = 0.018, p = -0.035
- Glutamic Acid, no parchment: B = 0.9, K1 = 0.042, kd = 0.009
- Glutamic Acid, with parchment: B = 0.9, K1 = 0.017, K2 = 0.002, p=-0.01
- Fructose, all cases: B = 8, kd = 0.024
How this model works
Any algebraic model can be replaced by a numerical version. In order to add an extra feature, the possibility of increase of external concentration via fermentation, it was simple to convert the original to a numerical equivalent, test that the results were the same (which they were), then to add the Growth rate, G. In this version, G is a constant but with extra parameters we can make it whatever is required.
1F. Hadj Salem , N. Achir, N. Sieczkowski, R. Boulanger, A. Collignan, Modelling the transfer and degradation kinetics of aroma compounds from liquid media into coffee beans during simulated wet processing conditions, Journal of Food Engineering 343 (2023) 111303
2F. Hadj Salem, F. Vasai, C. Duez, N. Sieczkowski, R. Boulanger, and A. Collignan, Mass Transfer Kinetics of Nonvolatile Compounds into Coffee Beans during Wet Processing: Study at the Laboratory Scale and in Real Conditions Using Two Yeast Strains, ACS Food Sci. Technol. 2022, 2, 852−861