
Baking
Quick Start
If you're not a scientist, just interested in cake and bread baking, Welcome! The app is designed for you to discover what's happening to temperatures and water content while you bake. For best results (and because it's interesting!), use the Water Content app to find out how much water is in the recipe and how light (or dense) your mix is. If you are a scientist then all the science is described in detail below.
Credits
The app was inspired one day by an especially delicious fruit cake slow-baked by my wife. The calculations use the method of top baking scientist Prof Emmanuel Purlis in Argentina.
Baking
//One universal basic required here to get things going once loaded
window.onload = function () {
    //restoreDefaultValues(); //Un-comment this if you want to start with defaults
    Main();
};

//Main() is hard wired as THE place to start calculating when inputs change
//It does no calculations itself, it merely sets them up, sends off variables, gets results and, if necessary, plots them.
function Main() {
    //Save settings every time you calculate, so they're always ready on a reload
    saveSettings();

    //Send all the inputs as a structured object
    //If you need to convert to, say, SI units, do it here!
    const inputs = {
        Tstart: sliders.SlideTstart.value,
        Toven: sliders.SlideToven.value,
        Tbaked: sliders.SlideTbaked.value,
        Diam: sliders.SlideD.value / 100, //cm to m
        rhoStart: sliders.SliderhoStart.value * 1000, //g/cc to kg/m3
        Expansion: sliders.SlideExpansion.value / 100, //% to fraction
        H: sliders.SlideH.value / 100, //cm to m
        tHot: sliders.SlidetHot.value * 60, //min to s
        tCool: sliders.SlidetCool.value * 60, //min to s
        water: sliders.Slidewater.value / 100, //% to fraction
        isFan: document.getElementById('isFan').checked,
        isFilledMap: document.getElementById('isFilledMap').checked,
        isTin: document.getElementById('isTin').checked || document.getElementById('isBreadmaker').checked,
        isBreadmaker: document.getElementById('isBreadmaker').checked,
    };

    //Send inputs off to CalcIt where the names are instantly available
    //Get all the resonses as an object, result
    console.time("time")

    const result = CalcIt(inputs);

    //Set all the text box outputs
    document.getElementById('toBake').value = result.toBake;
    // document.getElementById('Solid').value = result.sInfo;
    //Do all relevant plots by calling plotIt - if there's no plot, nothing happens
    //plotIt is part of the app infrastructure in app.new.js
    if (result.plots) {
        for (let i = 0; i < result.plots.length; i++) {
            plotIt(result.plots[i], result.canvas[i]);
        }
    }

    console.timeEnd("time")
    //You might have some other stuff to do here, but for most apps that's it for Main!
}

//Here's the app calculation
//The inputs are just the names provided - their order in the curly brackets is unimportant!
//By convention the input values are provided with the correct units within Main
function CalcIt({ Tstart, Toven, Tbaked, Diam, rhoStart, Expansion, H, tHot, tCool, isFan, isFilledMap, isTin, isBreadmaker, water }) {

    const R = Diam / 2
    const NySteps=NxSteps=tHot>1800?40:50
    const yStep = H/NySteps, xStep = R/NxSteps
    const tCook = tHot + tCool, Tovenstart = Toven
    const HTCFFan = 30, HTCFair = 20
    let HTCF = isFan ? HTCFFan : HTCFair
    let MTCF = isFan ? 8e-9 : 5e-9
    if (isBreadmaker) HTCF = 120
    let T = Create2DArray(NySteps), tmp = Create2DArray(NySteps), W = Create2DArray(NySteps), tmpW = Create2DArray(NySteps)
    let i, j
    let Wtot = 0
    for (i = 0; i < NySteps; i++) {
        for (j = 0; j < NxSteps; j++) {
            T[i][j] = Tstart
            tmp[i][j] = T[i][j]
            W[i][j] = water
            if (i > 0) Wtot += water
            tmpW[i][j] = W[i][j]
        }
    }
    const Nxy = Wtot / water
    let K = [], rho = [], D = [], Cps = [], Cpw = [], Pa = []
    const enthEvap = 2.3e6 //J/kg
    for (i = 1; i <= Toven; i++) {
        if (i <= 100) {
            K[i] = 0.2 + 0.9 / (1 + Math.exp(-0.1 * (i - 80)))
            rho[i] = rhoStart
            D[i] = 1e-10 //* 1000 / rhoStart
            Pa[i] = 133.322 * Math.pow(10, 8.0713 - 1730.63 / (i + 233.426)) //Antoine from mmHg to Pa
        } else {
            K[i] = 0.2
            rho[i] = rhoStart
            D[i] = 6e-8 //* 1000 / rhoStart
            Pa[i] = 1e6
        }
        iK = i + 273
        Cps[i] = 5 * iK + 25
        Cpw[i] = 1000 * (5.207 - 73.17e-4 * iK + 1.35e-5 * iK * iK)
        if (rhoStart>590) K[i] /= 2.0 //This is a kludge to allow bread to bake faster
    }

    //Water activity constant
    const aPower = -1 / 0.38
    const iM = Math.floor(NySteps / 2), jM = NxSteps - 1, iLast = NySteps - 1, iLast1 = iLast - 1
    const TRoom = 22
    let tNow = 0, tBig = 10, tNext = tBig, tStep = 0.5, CP = 0, TA = 0, dT = 0
    if (yStep<0.00051) tStep/=2
    let CData = [{ x: 0, y: Tstart }], WData = [{ x: 0, y: 100 * water }], TMax = 0
    let amCooking = true, hasBaked = false, toBake = "Unbaked"
    let yS2 = yStep * yStep, xS2 = xStep * xStep
    let Tmid = Tstart, expNow = 1
    if (isBreadmaker) Toven = 35
    while (tNow < tCook) {
        if (isBreadmaker && tNow < 600) {
            Toven = 35 + (Tovenstart - 35) * tNow / 600
        }
        if (tNow > tHot && amCooking) {
            amCooking = false
            //HTCF = HTCFair
            Toven = TRoom
            for (j = 0; j < NxSteps; j++) {
                T[0][j] = TRoom
                T[iLast][j] = TRoom  //Maybe exclude this line if we put it down so the bottom doesn't cool so fast
            }
            for (i = 0; i < NySteps; i++) {
                T[i][0] = TRoom
            }
        }
        if (Tmid < Tbaked) { expNow = 1 + Expansion * (Tmid - Tstart) / (Tbaked - Tstart) } else { expNow = 1 + Expansion }
        yS2 = yStep * yStep * expNow
        if (!isTin) xS2 = xStep * xStep * expNow
        //Water at the external surfaces
        for (j = 0; j <= NxSteps - 1; j++) {
            TA = Math.floor(T[0][j])
            a = 1 / (1 + Math.pow(100 * W[0][j] / Math.exp(-0.0056 * TA + 3.971), aPower))
            tmpW[0][j] = Math.max(0, W[0][j] - a * Pa[TA] * MTCF / yS2 + tStep * D[TA] * expNow * (W[0][j] - W[1][j]) / yS2)
        }
        //Heat at the surface
        for (i = 0; i <= NySteps - 1; i++) {
            TA = Math.floor(T[i][0])
            CP = Cps[TA] + W[i][0] * Cpw[TA]
            if (TA >= 99 && TA <= 101) CP += W[i][0] * enthEvap
            tmp[i][0] = T[i][0] + tStep * ((Toven - T[i][0]) * HTCF / (xStep * rho[TA] * CP) - (T[i][0] - T[i][1]) * K[TA] / (rho[TA] * CP) / xS2)
            if (!isTin) {
                a = 1 / (1 + Math.pow(100 * W[i][0] / Math.exp(-0.0056 * TA + 3.971), aPower))
                tmpW[i][0] = Math.max(0, W[i][0] - a * Pa[TA] * MTCF / yS2 + tStep * D[TA] * expNow * (W[i][0] - W[i][1]) / yS2)
            } else {
                if (i > 0 && i < NySteps - 1) tmpW[i][0] = W[i][0] + tStep * D[TA] * expNow * ((W[i - 1][0] - 2 * W[i][0] + W[i + 1][0]) / yS2 - (W[i][0] - W[i][1]) / (xS2))
            }
        }
        for (j = 0; j <= NxSteps - 1; j++) {
            //Top layer
            TA = Math.floor(T[0][j])
            CP = Cps[TA] + W[0][j] * Cpw[TA]
            if (TA >= 99 && TA <= 101) CP += W[0][j] * enthEvap
            tmp[0][j] = T[0][j] + tStep * ((Toven - T[0][j]) * HTCF / (yStep * rho[TA] * CP) - (T[0][j] - T[1][j]) * K[TA] / (rho[TA] * CP) / yS2)
            //Now the bottom
            TA = Math.floor(T[iLast][j])
            CP = Cps[TA] + W[iLast][j] * Cpw[TA]
            if (TA >= 99 && TA <= 101) CP += W[iLast][j] * enthEvap
            tmp[iLast][j] = T[iLast][j] + tStep * ((Toven - T[iLast][j]) * HTCF / (yStep * rho[TA] * CP) - (T[iLast][j] - T[iLast1][j]) * K[TA] / (rho[TA] * CP) / yS2)
        }
        for (i = 1; i < NySteps - 1; i++) { //The bulk
            for (j = 1; j < NxSteps - 1; j++) {
                TA = Math.floor(T[i - 1][j])
                CP = Cps[TA] + W[i][j] * Cpw[TA]
                if (TA >= 99 && TA <= 101) CP += W[i][j] * enthEvap
                tmp[i][j] = T[i][j] + tStep * K[TA] / (rho[TA] * CP) * ((T[i - 1][j] - 2 * T[i][j] + T[i + 1][j]) / yS2 + (T[i][j - 1] - 2 * T[i][j] + T[i][j + 1]) / (xS2))

                tmpW[i][j] = W[i][j] + tStep * D[TA] * expNow * ((W[i - 1][j] - 2 * W[i][j] + W[i + 1][j]) / yS2 + (W[i][j - 1] - 2 * W[i][j] + W[i][j + 1]) / (xS2))
            }
        }
        for (i = 1; i < NySteps - 1; i++) { //The middle vertical
            TA = Math.floor(T[i - 1][jM])
            CP = Cps[TA] + W[i][jM] * Cpw[TA]
            if (TA >= 99 && TA <= 101) CP += W[i][jM] * enthEvap
            dT = (T[i - 1][jM] - 2 * T[i][jM] + T[i + 1][jM]) * K[TA] / (rho[TA] * CP) / yS2
            dT += (T[i][jM - 1] - T[i][jM]) * K[TA] / (rho[TA] * CP) / (xS2)
            tmp[i][jM] = T[i][jM] + dT * tStep

            tmpW[i][jM] = W[i][jM] + tStep * D[TA] * expNow * ((W[i - 1][jM] - 2 * W[i][jM] + W[i + 1][jM]) / yS2 + (W[i][jM - 1] - W[i][jM]) / (xS2))
        }
        TA = Math.floor(T[iLast][jM]) //The central point
        CP = Cps[TA] + W[iLast][jM] * Cpw[TA]
        if (TA >= 99 && TA <= 101) CP += W[iLast][jM] * enthEvap
        dT = (T[iLast1][jM] - T[iLast][jM]) * K[TA] / (rho[TA] * CP) / yS2
        dT += (T[iLast][jM - 1] - T[iLast][jM]) * K[TA] / (rho[TA] * CP) / (xS2)
        tmp[iLast][jM] = T[iLast][jM] + dT * tStep

        tmpW[iLast][jM] = W[iLast][jM] + tStep * D[TA] * expNow * ((W[iLast][jM] - W[iLast1][jM]) / yS2 + (W[iLast][jM - 1] - W[iLast][jM]) / (xS2))

        for (i = 0; i < NySteps; i++) {
            for (j = 0; j < NxSteps; j++) {
                T[i][j] = tmp[i][j]
                W[i][j] = tmpW[i][j]
            }
        }

        if (tNow >= tNext) {
            if (!hasBaked && T[iM][jM] >= Tbaked) {
                toBake = (tNow / 60).toFixed(1) + "min"
                hasBaked = true
            }
            Tmid = T[iM][jM]
            iMs = Math.max(1, iM - 3); iMe = Math.min(iLast - 1, iM + 3)
            for (i = iMs; i < iMe; i++) {
                if (T[i][jM] < Tmid) Tmid = T[i][jM]
            }
            CData.push({ x: tNow / 60, y: Tmid })
            Wtot = 0
            for (i = 1; i < NySteps; i++) {
                for (j = 0; j < NxSteps; j++) {
                    Wtot += W[i][j]
                }
            }
            WData.push({ x: tNow / 60, y: 100 * Wtot / Nxy })
            TMax = Math.max(TMax, Tmid)
            tNext += tBig
        }
        tNow += tStep
    }

    //The plotting has some kludges for the cooling part
    //Hopefully things can be improved as the rest of the app also gets better
    let plotData = [], lineLabels = [], myColors = [], isStraight = [], isFilled = [], TStep = 10, lastJ = 0, plot = []
    for (let TC = 50; TC <= Tovenstart; TC += TStep) {
        // tst=80
        // for (let TC = tst; TC <= tst; TC += TStep) {
        plot = []
        hullpts = []
        for (i = 0; i < NySteps; i++) {
            for (j = 0; j < NxSteps; j++) {
                if (amCooking){
                if ( T[i][j] < TC + TStep) hullpts.push([100 * (NxSteps - 1 - j) * xStep, 100 * (NySteps - i) * yStep * expNow])} else {if ( T[i][j] > TC - TStep) hullpts.push([100 * (NxSteps - 1 - j) * xStep, 100 * (NySteps - i) * yStep * expNow])}
                    // if ( T[i][j] < TC + TStep) hullpts.push([100 * (NxSteps - 1 - j) * xStep, 100 * (NySteps - i) * yStep * expNow])
            }
        }
        if (hullpts.length > 1) {
            //The convex hull code from https://github.com/AndriiHeonia/hull
            pts = hull(hullpts, 100)
            //Indirect Hull to plot
            minx = 9999, mini = 0
            for (i = 0; i < pts.length; i++) {
                if (pts[i][1] < minx) { minx = pts[i][1]; mini = i }
            }
            newpts = []
            for (i = 0; i < pts.length; i++) {
                j = i + mini
                if (j > pts.length - 1) j -= pts.length
                newpts[i] = pts[j]

            }
            for (j = 0; j < newpts.length; j++) {
                if (j == 0 || newpts[j][0] > 0 || !(newpts[j - 1][0] == 0 && newpts[j][0] == 0)) plot.push({ x: newpts[j][0], y: newpts[j][1] })
            }

            // //Straight from Hull to plot
            // for (j = 0; j < pts.length; j++) {
            //     plot.push({ x: pts[j][0], y: pts[j][1] })
            // }
        }
        //console.log( plot)

        if (plot.length > 1) {
            //Now replicate the other half
            whole = [];
            for (i = 0; i < plot.length; i++) {
                x = plot[i].x; y = plot[i].y
                whole.push({ x: x, y: y })
            }
            for (i = whole.length - 1; i >= 0; i--) {
                x = whole[i].x; y = whole[i].y
                plot.push({ x: -x, y: y })
            }
            plotData.push(plot)
            lineLabels.push(TC)
            isStraight.push(true)
            isFilled.push(isFilledMap)
            rbow = Rainbow((TC - 50) / (Tovenstart - 50))
            myColors.push("rgb(" + rbow.r + "," + rbow.g + "," + rbow.b + ")")
        }
    }
    if (!amCooking) {
        plotData.reverse()
        lineLabels.reverse()
        myColors.reverse()
    }

    //Finally the colour-coding scale
    const CPlt = [CData, WData], CPltLabels = ["Centre T", "Centre W"], CPltColors = ["gold", "skyblue"], yAxisL1R2 = [1, 2]
    for (i = 50; i <= Tovenstart; i += 4) {
        tmp = []
        tmp.push({ x: 0, y: i }); tmp.push({ x: tCook / 600, y: i })
        CPlt.push(tmp)
        CPltLabels.push(i)
        rbow = Rainbow((i - 50) / (Tovenstart - 50))
        CPltColors.push("rgb(" + rbow.r + "," + rbow.g + "," + rbow.b + ")")
        yAxisL1R2.push(1)
    }

    //Now we return everything - text boxes, plot and the name of the canvas, which is 'canvas' for a single plot
    const prmap = {
        plotData: plotData, //An array of 1 or more datasets
        lineLabels: lineLabels, //An array of labels for each dataset
        isStraight: isStraight,
        isFilled: isFilled,
        hideLegend: true,
        colors: myColors, //An array of colors for each dataset
        xLabel: 'x&cm', //Label for the x axis, with an & to separate the units
        yLabel: 'y&cm', //Label for the y axis, with an & to separate the units
        y2Label: null, //Label for the y2 axis, null if not needed
        yAxisL1R2: [], //Array to say which axis each dataset goes on. Blank=Left=1
        logX: false, //Is the x-axis in log form?
        xTicks: undefined, //We can define a tick function if we're being fancy
        logY: false, //Is the y-axis in log form?
        yTicks: undefined, //We can define a tick function if we're being fancy
        legendPosition: 'top', //Where we want the legend - top, bottom, left, right
        xMinMax: [,], //Set min and max, e.g. [-10,100], leave one or both blank for auto
        yMinMax: [,], //Set min and max, e.g. [-10,100], leave one or both blank for auto
        y2MinMax: [,], //Set min and max, e.g. [-10,100], leave one or both blank for auto
        xSigFigs: 'P3', //These are the sig figs for the Tooltip readout. A wide choice!
        ySigFigs: 'P3', //F for Fixed, P for Precision, E for exponential
    }
    const prmap1 = {
        plotData: CPlt, //An array of 1 or more datasets
        lineLabels: CPltLabels, //An array of labels for each dataset
        colors: CPltColors, //An array of colors for each dataset
        hideLegend: true,
        xLabel: 't&min', //Label for the x axis, with an & to separate the units
        yLabel: 'T centre&°C', //Label for the y axis, with an & to separate the units
        y2Label: "Water&%", //Label for the y2 axis, null if not needed
        yAxisL1R2: yAxisL1R2, //Array to say which axis each dataset goes on. Blank=Left=1
        logX: false, //Is the x-axis in log form?
        xTicks: undefined, //We can define a tick function if we're being fancy
        logY: false, //Is the y-axis in log form?
        yTicks: undefined, //We can define a tick function if we're being fancy
        legendPosition: 'top', //Where we want the legend - top, bottom, left, right
        xMinMax: [,Math.round(tCook/60)], //Set min and max, e.g. [-10,100], leave one or both blank for auto
        yMinMax: [,], //Set min and max, e.g. [-10,100], leave one or both blank for auto
        y2MinMax: [0,], //Set min and max, e.g. [-10,100], leave one or both blank for auto
        xSigFigs: 'P3', //These are the sig figs for the Tooltip readout. A wide choice!
        ySigFigs: 'P3', //F for Fixed, P for Precision, E for exponential
    }
    return {
        toBake: toBake + " : " + (100 * (water - Wtot / Nxy)).toFixed(0) + "%",
        plots: [prmap, prmap1],
        canvas: ['canvas', 'canvas1'],
    };
}
function mySort(a, b) {
    if (a[0] == b[0]) return (a[1] - b[1])
    return a[0] - b[0]
}
function Create2DArray(rows) {
    var arr = [];
    for (var i = 0; i < rows; i++) {
        arr[i] = [];
    }
    return arr;
}
var RB = [[0, 48, 245], [0, 52, 242], [0, 55, 238], [0, 59, 235], [3, 62, 231], [9, 66, 228], [14, 69, 225], [18, 72, 221], [20, 74, 218], [22, 77, 214], [23, 80, 211], [24, 82, 207], [25, 85, 204], [25, 87, 200], [25, 90, 197], [25, 92, 193], [25, 94, 190], [25, 96, 187], [24, 99, 183], [24, 101, 180], [24, 103, 177], [23, 105, 173], [23, 106, 170], [24, 108, 167], [24, 110, 164], [25, 112, 160], [27, 113, 157], [28, 115, 154], [30, 117, 151], [32, 118, 148], [34, 120, 145], [36, 121, 142], [39, 122, 139], [41, 124, 136], [43, 125, 133], [45, 126, 130], [47, 128, 127], [49, 129, 124], [51, 130, 121], [53, 132, 118], [54, 133, 115], [56, 134, 112], [57, 136, 109], [58, 137, 106], [59, 138, 103], [60, 139, 99], [61, 141, 96], [62, 142, 93], [62, 143, 90], [63, 145, 87], [63, 146, 83], [64, 147, 80], [64, 149, 77], [64, 150, 74], [65, 151, 70], [65, 153, 67], [65, 154, 63], [65, 155, 60], [66, 156, 56], [66, 158, 53], [67, 159, 50], [68, 160, 46], [69, 161, 43], [70, 162, 40], [71, 163, 37], [73, 164, 34], [75, 165, 31], [77, 166, 28], [79, 167, 26], [82, 168, 24], [84, 169, 22], [87, 170, 20], [90, 171, 19], [93, 172, 18], [96, 173, 17], [99, 173, 17], [102, 174, 16], [105, 175, 16], [108, 176, 16], [111, 176, 16], [114, 177, 17], [117, 178, 17], [121, 179, 17], [124, 179, 18], [127, 180, 18], [130, 181, 19], [132, 182, 19], [135, 182, 20], [138, 183, 20], [141, 184, 20], [144, 184, 21], [147, 185, 21], [150, 186, 22], [153, 186, 22], [155, 187, 23], [158, 188, 23], [161, 188, 24], [164, 189, 24], [166, 190, 25], [169, 190, 25], [172, 191, 25], [175, 192, 26], [177, 192, 26], [180, 193, 27], [183, 194, 27], [186, 194, 28], [188, 195, 28], [191, 195, 29], [194, 196, 29], [196, 197, 30], [199, 197, 30], [202, 198, 30], [204, 199, 31], [207, 199, 31], [210, 200, 32], [212, 200, 32], [215, 201, 33], [217, 201, 33], [220, 202, 34], [223, 202, 34], [225, 202, 34], [227, 203, 35], [230, 203, 35], [232, 203, 35], [234, 203, 36], [236, 203, 36], [238, 203, 36], [240, 203, 36], [241, 202, 36], [243, 202, 36], [244, 201, 36], [245, 200, 36], [246, 200, 36], [247, 199, 36], [248, 197, 36], [248, 196, 36], [249, 195, 36], [249, 194, 35], [249, 192, 35], [250, 191, 35], [250, 190, 35], [250, 188, 34], [250, 187, 34], [250, 185, 34], [250, 184, 33], [250, 182, 33], [250, 180, 33], [250, 179, 32], [249, 177, 32], [249, 176, 32], [249, 174, 31], [249, 173, 31], [249, 171, 31], [249, 169, 30], [249, 168, 30], [249, 166, 30], [248, 165, 29], [248, 163, 29], [248, 161, 29], [248, 160, 29], [248, 158, 28], [248, 157, 28], [248, 155, 28], [247, 153, 27], [247, 152, 27], [247, 150, 27], [247, 148, 26], [247, 147, 26], [246, 145, 26], [246, 143, 26], [246, 142, 25], [246, 140, 25], [246, 138, 25], [245, 137, 24], [245, 135, 24], [245, 133, 24], [245, 132, 24], [244, 130, 23], [244, 128, 23], [244, 127, 23], [244, 125, 23], [244, 123, 22], [243, 121, 22], [243, 119, 22], [243, 118, 22], [243, 116, 21], [242, 114, 21], [242, 112, 21], [242, 110, 21], [241, 109, 21], [241, 107, 21], [241, 105, 21], [241, 103, 21], [240, 101, 21], [240, 100, 22], [240, 98, 22], [240, 96, 23], [240, 95, 24], [240, 93, 26], [240, 92, 27], [240, 90, 29], [240, 89, 31], [240, 88, 33], [240, 87, 36], [240, 87, 38], [241, 86, 41], [241, 86, 44], [242, 86, 47], [242, 86, 51], [243, 86, 54], [243, 87, 58], [244, 88, 62], [245, 88, 65], [245, 89, 69], [246, 90, 73], [247, 91, 77], [247, 92, 82], [248, 94, 86], [249, 95, 90], [249, 96, 94], [250, 97, 98], [251, 99, 102], [251, 100, 106], [252, 101, 111], [252, 103, 115], [253, 104, 119], [253, 105, 123], [254, 107, 128], [254, 108, 132], [255, 109, 136], [255, 111, 140], [255, 112, 145], [255, 114, 149], [255, 115, 153], [255, 116, 157], [255, 118, 162], [255, 119, 166], [255, 120, 170], [255, 122, 175], [255, 123, 179], [255, 125, 183], [255, 126, 188], [255, 127, 192], [255, 129, 196], [255, 130, 201], [255, 132, 205], [255, 133, 210], [255, 134, 214], [255, 136, 219], [255, 137, 223], [255, 139, 227], [255, 140, 232], [255, 141, 236], [254, 143, 241], [254, 144, 245], [253, 146, 250]]
function Rainbow(v) {
    var i = Math.floor((Math.min(v, 1), Math.max(v, 0)) * 255)
    r = RB[i][0]
    g = RB[i][1]
    b = RB[i][2]
    return { r: r, g: g, b: b }
}
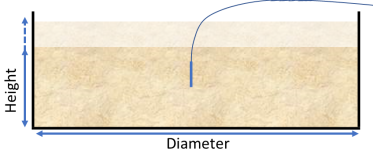 You've just put your cake or bread into the oven. If it's round it has a Diameter and a Height, it it's a rectangle then you set the Diameter value to its Width. The oven has a temperature TOven. You plan to bake it for a time tBake and you know that it will rise by a known Expansion %. We can imagine (or we can place) a thermocouple probe in the middle to know what's going on
Obviously the outside gets hot rather quickly and it's easy to tell if it's under- or over-cooked. But the real problem is the middle. If you don't cook for long enough, the middle is under-cooked. And if you have the oven too hot, the outside will be burned and the middle might still be under-cooked.
If we define a target temperature, TBaked which might be something like 95-100°C then we just need to look at the right-hand graph which tells us the temperature in the middle (plus the water content). [Use your mouse to read out values.]. For a short time, nothing happens! It takes time for heat to flow through the mix. Then it rises steadily. If tBake is too small, then the centre never reaches your baking point. If it's too large then the although the centre temperature might remain constant near 100°C, the overall result will be either burned on the outside or over-dried. You can read the time to baking from the graph, but the app also provides the time, along with the loss of water, in the output box.
Water content
The water content is imporant. Undercooked, with too much water, we have a soggy disaster. Overcooked, with too little water, the result tastes and feels too dry. We need to know the % of water at the start and this can be estimated using the Water Content app. The blue line in the graph shows how the % water changes during baking. The text box tells you the % loss in weight, which leads to an interesting point.
It would be a very good habit to measure the weight of the mix at the start then weigh the final baked cake or bread. This can easily be done in the tin, as long as you remember to measure and record the empty tin weight. The loss of water during baking is a significant factor and after a while you will be able to tell how well baked something is by briefly taking it out of the oven to weigh it. It's a good idea to put something like a plate onto the scales first so the measuring pan never get heated during your brief weighing.
Better baking
For a given density/expansion, weight and moisture content of the mix, baking depends on:
- Diameter or Width
- Oven temperature
- Baking time
- Tin or no tin (for bread)
- Fan or fanless
The app lets you explore all the options. If you increase the size of the baking tin then the original height decreases so baking is significantly faster. A 40% increase in diameter (or for a rectangular tin both width & length) means a halving of the height. A higher temperature will more easily over-cook the outside even if the inside cooks faster. A longer baking time allows you to use a lower temperature. Without the walls of the tin, water escapes faster. If the oven is fanless then the air next to the baking tin is cooled by the contents, so the heating is slower. Turning on the fan allows fresh hot air to push away "stuck" cold air, so baking is faster. If you've seen recipes saying "180°C [160°C fan] you can test this for yourself in the app. Find the baking time at 180°C with the fan off, then turn on the fan and reduce the oven temperature till you get the same baking time. Hopefully it agrees OK with what your recipes say.
So far we've just looked at the temperature in the centre. What about the temperatures throughout the mix?
Temperature in the whole mix
The temperature "map" plots lines of constant temperature reached at your baking time (forgive the glitches - it's very hard to produce a good map). So there might be a 60°C zone near the middle with a 170°C zone near the top and around the side. The zones are rainbow colour coded from blue to red, from 50°C to your chosen oven temperature. Move your mouse to get a readout of any area.
Some users like the line map (contours) some prefer the Filled map view where it's easier to see the gradations from cold to hot. The colour code is shown in the graph on the right.
Density and Expansion
If you have a very dense cake batter (e.g. a fruit cake), it takes a lot more heat to raise the temperature compared to the same volume of a bread dough that has risen before baking. This means, unfortunately, that you have to specify a starting density. A bread dough might have a density of 0.4 g/cc, a classic pre-aerated sponge, 0.6, a sponge with chemical raising agent might be over 1 and a fruit cake might be 1.3. You can get a good estimate of your density via the Water Content app.
Expansion slows down the cooking because it is harder for heat to flow through a foam structure than through liquid or solid. So we need to know your starting density and the (approximate) expansion, where 100% is twice the size. For simplicity, even for the no-tin case, expansion takes place only in the height direction.
Cooling
If you've baked for, say, 25min, slide TCool to give 5-10min of cooling. If you look at the graph of temperature in the middle you might be surprised. It just carries on rising for a while! This makes sense. Although the outside is starting to cool, hotter parts of the interior can still pass on their heat to cooler parts deeper inside. So although everything might be baked perfectly when you take it out, it might be over-cooked by the time you get to try it. Or if it was under-cooked in the centre when you take it from the oven might be perfect when you try a slice later.
Apologies for the colour map on cooling. It's even harder to get right.
The science bit
There are plenty of simplifying assumptions. The batter/dough is perfectly flat at the start, heat flows equally through the top, the base and through the sides, and your oven is exactly at the specified temperature. If you are baking without a tin, you still have to pretend that it starts, and remains, as a perfect cylinder.
But there are plenty of complications. As the mixture warms, the rate at which heat can flow (the thermal conductivity) changes. Basically it rises with temperature thanks to heat flow via water evaporation, then falls rapidly when the cake loses water and goes solid. Similarly, the rate at which water diffuses and exits from the surface is highly temperature-dependent. We also have the complexity of expansion.
The app works by dividing the system into a number of "cells" and baking is assumed to take place via a number of time steps. At each step the amount of heat flowing into or out of a cell depends on the temperatures of the cells around it and the temperature changes according to the heat flow and the local "heat capacity" (very strongly-dependent on water content) and density. Similar calculations allow the water content in each cell to change. At the end of each time step, the temperature and water-content values are updated and the process repeats.
The number of cells depends on how fine each slice through the batter/dough should be. The finer the slices, the more accurate the result. Similarly, the smaller the timestep, the better the accuracy. Clearly there's a trade-off with calculation speed. The chosen parameters seem to work well-enough, i.e. if you double them, the calculated results don't change too much, though the calculation time gets 4x longer.
The only way a model can be made to work is by having lots of experimentally derived values from the literature then via some further tweaking the parameters to match experiments. The starting point was an excellent set of data on Génoise sponge cakes (they are pre-foamed and don't rise too much) in the paper: Edward A. Olszewski, From baking a cake to solving the diffusion equation, Am. J. Phys. 74, 2006, 502-509. It quickly becomes apparent that the specific model is too simple (it doesn't model water content) and contains some contradictions, but the experimental data are very useful. Other references had other examples and recommended parameters. Here are some of them.
Emmanuel Purlis, Viviana O. Salvadori, Bread baking as a moving boundary problem. Part 2: Model validation and numerical simulation, Journal of Food Engineering, 91 (2009) 434–442
B. Zanoni, S. Pierucci & C. Peri, Study of the Bread Baking Process - II. Mathematical Modelling, Journal of Food Engineering, 23 (1994) 321-336
Melike Sakin, Figen Kaymak-Ertekin, Coskan Ilicali, Simultaneous heat and mass transfer simulation applied to convective oven cup cake baking, Journal of Food Engineering 83 (2007) 463–474
My thanks to family and neighbours who kindly provided their own experimental data so that results generally seemed to agree across a range of baking styles, equipment and recipes. There were a few "aha" moments from their data which made all the difference. The addition of the Density calculation came from one of those moment. I also especially appreciated the early beta feedback testing from scientist/baker Kaja Harton.