WLF - tTE - tTS
Quick Start
This app has proven popular with users from many communities other than adhesion, because the principle behind it is profound and powerful: that you can simulate temperature effects by changing the timescale of your experiment, or that you can simulate timescale with temperature. A lot of adhesion science (PSA and beyond) makes no sense without understanding this principle. It's a bit tricky so take it slowly. The app towards the end helps you to put the ideas into practice. The more sophisticated WLF-K lets you explore your own datasets.
Temperature and time (the same as speed) are strongly interrelated and are a key part of the "systems" thinking necessary to understand adhesion. This relationship can be described with three acronyms, all meaning the same thing:
- WLF Williams-Landel-Ferry
- tTE time-Temperature Equivalence
- tTS time-Temperature Superposition
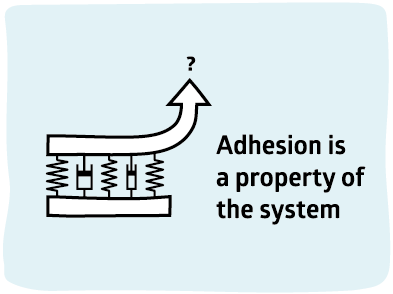
We have seen that the peel strength of a PSA depends on an unlikely combination of a system with a high tensile stress combined with a low viscosity. But we all know that both tensile stress and viscosity depend on how quickly you measure them. A very sharp pull will give a very different measure of tensile stress than a long, slow one. And a viscosity measured at a low shear rate can be very different from that measured at a high shear rate. So in a sense the Feldstein equation is meaningless unless the time-scale is mentioned, though the τ value in the equation already offers some clues that time is important.
It is frequently noticed that a great PSA when tested with a sudden pull is useless when tested with a long, slow pull, and vice versa. So speed or timescale are clearly important for real systems. [A good way to encode speed and timescale is via the Deborah Number.] And we know that a great PSA at 25°C might be useless at 40°C or at 10°C or, indeed both, or, to be more precise, its high-speed or low-speed peel might be useless at a different temperature.
To make sense of all this might seem to require lots of measurements at many different speeds and temperatures - a nightmare for the practical formulator. Fortunately one of those ubiquitous laws of physics comes to our aid.
Time is equivalent to Temperature
Let us do a peel test at a two different speeds at a given temperature. Because time is equivalent to temperature we can calculate that the high speed value will be obtained at low speed at a lower temperature and that the low speed result will be obtained at high speed at a higher temperature. Similarly, if we do a test at a given speed at two temperatures we know that we can obtain the high temperature result at a lower speed and the low temperature result at a higher speed. The good news is that there is a (relatively) simple equation to convert temperature into time. It was developed by Williams, Landel and Ferry and is called WLF. It says:
`Log(a_t)=-(C_1(T-T_r))/(C_2+T-T_r)`
Here we have two constants, C1 and C2, we have the temperature of interest, T and a reference temperature Tr. From these we calculated at which is the amount by which the time has to be shifted to get the same result at T as you would get at Tr.
Before providing the means for you to calculate this, let's see what this actually means. On the left is a famous dataset from Ahagon et al which shows how Log(W) (work of adhesion) depends on Log (Peel Rate) at different temperatures. This happens to be more to do with a "real" adhesive than a PSA, but the principles are the same. The data are all very interesting, but you can imagine that it wasn't much fun to collect them all:
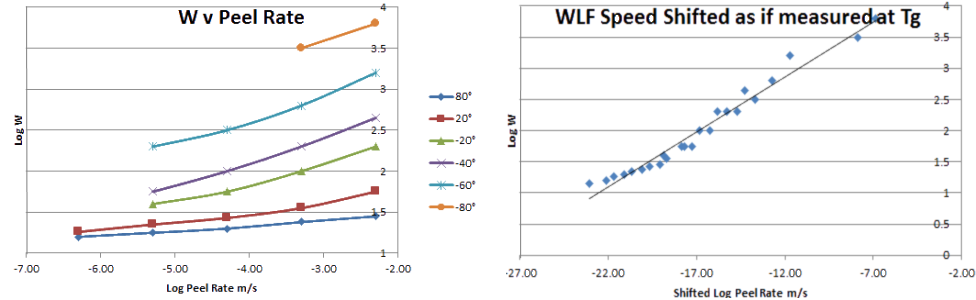
Now let's look at the graph on the right to see the same data time shifted via WLF. All the data on the left fall neatly into a single curve. Indeed a lot of plots of PSA data are actually WLF-shifted plots, but you often have to read captions carefully to spot what's happening, because the trick is so common. Note that the time shifting is quite severe. The high peel rates (0.01mm/s) at 80°C get shifted down to ~10-20mm/s to get the same values at the Tg of -90°C - not the sorts of speeds relevant to a real-world experiment!
Let's see how those datasets really are the same thing. Change the three parameters, Tg, C1 and C2 till the datapoints (keeping their original colours) fall on an adequately single curve. The default value of Tg the first time you run the app is deliberately set very high (-25°) so you can see the dramatic effect of Tg on the WLF shift. The meanings of C1 and C2 are discussed below.
WLF Fitting to a -80°C elastomer
As you will see, you can't get a perfect straight line, and there is quite a lot of latitude in the various settings. But you get the general idea that points measured at very different temperatures can be plotted in a single curve when shifted by WLF
You can try out your own WLF shifts with the calculator below. In the absence of any other data, assume that Tg is -25°C and that C1=17.5 and C2=51.6 as these are the default values used throughout the PSA industry.
WLF Shifting of a PSA's peel
You have a choice: Log(at) can be shown at the current temperature relative to the reference temperature or at the current temperature relative to 25°C. The former is more usual scientifically, the latter is more useful to see how a lab measurement will shift if it is done at a temperature different from 25°C.
As an example, using the default values and selecting the Ref=25 option then the relaxation processes at 33°C are twice as fast, so to mimic the results at 29°C the test at 25°C must be done at half the speed so that the relaxation matches the test process, or to predict the results of a measurement carried out at 21°C the experiment at 25°C must be carried out at twice the speed.
You will see that the meaning of at is kept deliberately vague; is it time or is it 1/time=frequency=speed? It depends how you look at it. With a bit of practice you can work out whether to use at or 1/at!
What do C1 and C2 mean? C1 is a measure of the range of times/frequencies spanned by that process over the entire relevant temperature range. To say that it is 17.5 is to say that there are 17.5 orders of magnitude in the process. C2 is the temperature range that changes the process by half C1; in other words over 51.6 °C the process changes by ~8.5 orders of magnitude.
This is all very nice, but what does it have to do with PSA? To answer that we have to take another apparent diversion, into the land of G-Values in the next app.
YouTube Video and some real-world data
I have a popular YouTube video that describes WLF and mention a spreadsheet of some real-world data that I happened to gather one day (it is not important what it is!) and had to hastily analyze without access to the software on the rheometer. Lots of people have asked for access to the spreadsheet, so here is WLF Example.xls, slightly tidied up with some simple instructions.
The physics of caramel
Here is a delightful and insightful paper, Simplicity in complexity – towards a soft matter physics of caramel by Simon Weir, Keith M. Bromley, Alex Lips and Wilson C. K. Poon, which is Open Access so freely downloadable. In the paper the tTS principles are used to help understand caramel. But, tTS isn't the only game in town. There is also tQS (Time-Cure Superposition, or Time-Crosslinking Superposition) and tCS (Time-Composition Superposition). It turns out that both tQS and tCS are "well-known principles" but until I read the caramel paper, they were not well-known to me. tQS is especially important for PSA because the (small) degree of crosslinking in a PSA is especially important for functionality.
And the physics of dough
An equally delightful and insightful paper Pressure-Sensitive Adhesive Properties of Wheat Flour Dough and the Influence of Temperature, Separation Rate, and Moisture Content, by S. S. Heddleson, D. D. Hamann, D. R. Lineback, and L. Slade, freely downloadable via that link, shows that bread dough can be considered as a PSA, and that not only is tTS applicable to the stickiness of dough, but also tWS (Time-Water Superposition). Arguably tWS is the same as tCS in the Caramel paper. But the point is that these large superposition effects are a general aspect of physics, not some rarified concept that applies just to PSA.