Drop Squeeze
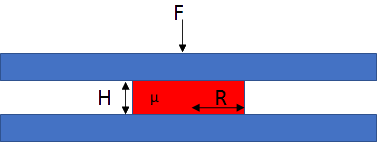
If you put a drop of adhesive with thickness H0 and radius R0 between two surfaces and squeeze with a force F, then depending on the viscosity μ the drop will expand and the thickness will decrease. The app shows the rapid squeezing at the start, slowing down dramatically as the gap gets smaller. If you have a reactive adhesive then the option exists to incorporate the increase of viscosity within the app.
An alternative view of squeeze flow for UV embossing can be found at Stefan's Law within Practical Coatings
Drop Squeeze
 If you place a drop of adhesive between two surfaces and squeeze, what forces and times are required for the drop to spread to the required radius, and what happens to the thickness of the adhesive during the spreading?
The theory is from Stefan in 1874 and, intriguingly, it is concerned with the reverse calculation - how much adhesive force is measured as you try to open up a thin layer of liquid adhesive. But physics is reversible so his equation is mostly used to describe squeeze flow. It uses simple assumptions but is good enough for our purposes. We can use the theory in the form that calculates the rate of change of thickness H with time t as a function of force F, viscosity μ and current radius of the drop R:
`(δH)/(δt)=(2FH^3)/(3πμR^4)`
You start with an idealised cylinder of thickness H0 and radius R0 and then squeeze it for a total time tmax.
Because you are likely to know the volume of the adhesive drop with some idea of the initial radius but no idea of its idealised height, the volume of the initial cylinder is calculated. You can then alter H0 until the calculated idealised volume is similar to that of your real drop.
The graphs tell you what you want to know, with the thickness graph plotted on a Log scale because a linear graph shows a rapid drop and an uninformative long plateau. The final radius, Rmax and thickness Hmin are also shown in the output boxes. Because the Bubble Gone! app requires a value for the pressure, the pressures P0 at the start and Pmax at the end of the squeeze are given via `P=F/"Area"`.
For those who use reactive adhesives, you can choose a viscosity μmax at tmax with the simple assumption of exponential increase with time from the original value μ0.
Scott Equation
I am grateful to Dr Holger Fricke from Fraunhofer IFAM for pointing out that shear-thinning adhesives follow Scott's variant of the Stefan equation, adding in an initial low-shear viscosity of A and a power-law factor n.
The app now contains an Afactor that describes how much higher the low-shear viscosity is than the μ0 high-shear viscosity that is entered, and n, the power law less than 1. The Scott equation is typically shown, with V=δH/δt:
`F=2π((2n+1)/n)^n(AV^nR^(n+3))/((m+3)H^(2n+1))`
You will easily confirm that when A=μ0, i.e. Afactor=1 and n=1 we return to the Stefan equation.
Note that if Afactor>1 then the calculation about viscosity increasing via cure is turned off, i.e. μmax is ignored.