Fragmentation Test
Quick Start
Like the 4-point bend test Fragmentation looks very sciencey and can tempt us into thinking that this will give us "real" physics rather than our generally simpler tests. This may be true for those who put, say, TiN onto silicon. But for the rest of us, these apparently sophisticated tests are just a complicated way of producing numbers only vaguely related to our real-world problem.
Have a read through the text and play with the app. But then resolve only to use it for those TiN samples!
As discussed in the 4-Point test, measuring the adhesion of thin, brittle films is difficult, especially on non-brittle substrates. The fragmentation test gives some idea of the adhesion of brittle coatings on polymers, though the numbers it gives are not necessarily providing deep insights into the adhesion and, in cases of "good" adhesion may simply provide a measure of the tensile strength of the polymer substrate.
The essence of the test is to create cracks by stretching the film then to analyse the crack distribution to arrive at the desired parameter. But how do you count the μm-sized cracks in a 20nm transparent SiOx coating?
 A good way of doing the test has been described by Tetra Pak1 for whom adhesion of barrier materials such as SiOx is important. The sample is placed in a micro-tensile stretcher which itself is placed in an AFM. At each increment of strain (% stretch) the surface is scanned by the AFM and any wrinkles (not further described in this page) or cracks are detected. A plot of crack density, i.e. number of cracks per μm, versus strain is the key output of the measurement. The initial part of the graph is linear and is used to calculate some key variables, using methods provided2 by the Månson group at the Ecole Polytechnique Fédérale de Lausanne. From the data, four parameters can be derived:
- COS the Crack Onset Strain
- CDsat the Saturation Crack Density in cracks/μm
- σmax the cohesive strength of the coating
- τ the interfacial shear strength between the coating and substrate
The COS depends on many factors including coating thickness and adhesion; lower thickness and/or stronger adhesion increases COS. Although some formulae exist for estimating COS they are not included here as they have so far proven to have to many unknowable parameters. As a rough guide, COS goes as 1/hc½.
It often looks as though annealed barriers have a larger COS. Some of this improvement is an illusion. If the annealing compresses the coating it needs a greater strain to achieve the same extension of the coating. You can simulate this by entering a value for C-Strain - the initial Compressive strain. This in turn can be calculated from the initial curl of the coated sample as per the Curl app. The value used in the calculation is limited to COS-0.1% otherwise the calculations start to make no sense. The calculated values diminish because they now reflect the true strain rather than the measured strain. Keep C-Strain at 0 if this is all too complicated.
CDsat also depends on many things. In general, for a given adhesion, a thinner coating will give more cracks per unit length because the same stress can fracture more of the coating. From CDsat can be calculated lc which is the critical length defined as the smallest length of the coating that can undergo fragmentation: lc=1.496/CDsat
It is not obvious what σmax really is. It is derived via a Weibull statistics analysis of the distribution of crack lengths with respect to the applied stress. Why Weibull? Because cracking, like so much in adhesion measurement, doesn't give a simple normal distribution and it needs more complex statistics to describe it. σmax is actually a function of whatever crack length scale is of interest to you, but for this app it is taken to apply to lc, which was discussed in the previous paragraph. The value of σmax can depend strongly on imperfections in the substrate - reminding us that the cohesive strength of a coating can be greatly affected by factors other than its modulus.
τ is what this is all supposed to be about. It is the interfacial shear strength. After the chain of reasoning leading to σmax defined at lc then from this and the thickness of the coating hc and some assumptions (Kelly-Tyson) that the there is perfect plastic flow at the interface we get:
`τ = (2h_cσ_"max")/l_c`
What this τ really means in practice is another question. If it equals the tensile strength of the polymer then the value is simply a lower limit of the "real" adhesion. If it is much lower than that of the polymer then presumably there is a warning that adhesion could be improved. How much improvement is required? Note that the test involves strains of many %. In typical web processes (especially of barrier films) we shouldn't be anywhere near those sorts of strains. A 1m wide, 12μm PET of 4GPa modulus needs a stress of 500N to give a 1% strain, so if the COS is 3% that's 1500N/m.
τ is a pure shear value. As is stressed in the analyses of peel and lap joints, the real forces challenging adhesion are rarely "pure" and usually contain a lot of peel stresses as well as shear stresses. So if our coating has a measured pure shear stress, how well will it cope with the complex mix of forces in, say, a tape test? I think the answer is "no-one knows." If you have a spare AFM, a computer-controlled micro-stress generator and the ability to do Weibull analyses, this is the test for you. If not, the question is what is the likelihood of adhesive failure of your 20nm coating in its end use, compared to its failure as, e.g. a barrier? If the real concern is about barrier failure, is it easier to do pragmatic tests such as mandrel bending or Gelbo flexes and test the barrier properties? Note, too, that for really thin coatings grain boundaries take on greater significance in terms of barrier performance and it's not clear that the assumptions behind the model used here are valid when crack density is dominated by grain density.
The app, of necessity, can't take in raw test data and provide the answers. Instead you provide some values that define the curve of crack density with strain. These are: CDsat - the crack density at saturation; CDEOL the crack density at the End Of the Linear region; Strainsat - the strain at which the cracks saturate; StrainEOL - the strain at the end of the linear region; COS - the Crack Onset Strain; hc - the coating thickness. You also need to provide the modulus of the coating itself.
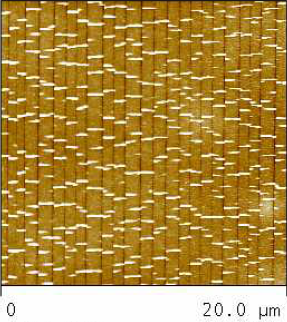
The graph shows the crack density plot and the graphic gives some idea of what a 20μm AFM scan would look like in terms of cracks (black vertical lines) and buckling between cracks (white horizontal lines - obviously via Poisson the samples is under compression in the transverse direction) at the strain set by StrainAFM. The calculated values for the cohesive strength and the interfacial shear stress are provided along with the critical length lc (the smallest fragment that can undergo failure) and the Weibull α and β with β often called the Weibull Modulus. The fracture toughness Gc is a sort of "work of adhesion" (often called a "strain energy release rate") in that it is the energy required to create 1m2 of fresh coating surface. It is simply the cohesive strength (MPa = J/m³) times hc.
Fragmentation
For those for whom all this is far too much work, one suggestion from an industry expert is to place an acoustic emission device on the sample in a simple tensile stretcher and the characteristic sound of cracks being formed reveals the Crack Onset Strain. As mentioned above, the value is rather hard to relate to fundamental known quantities, but in general the larger it is the happier the system - whether because the coating is thinner, the adhesion is higher or the coating is simply more ductile.
The generous help of Dr Charles Bishop of CA Bishop Consulting and of Dr Pierre Fayet of Tetra Pak (plus permission to use the AFM graphic from their paper) is warmly acknowledged. All errors are my responsibility.
2Y. Leterrier, L. Boogh, J. Andersons, J.-A. E. Månson, Adhesion of Silicon Oxide Layers on Poly(ethylene terephthalate). I & II, J. Poly. Sci. B: Polymer Physics, 35, 1449-1461 and 1463-1472