Particle Flow
Quick Start
If you have found it hard to get particles to flow, then the two apps below help explain why. It's all rather complicated, but the apps help clarify things for those who have this specific interest!
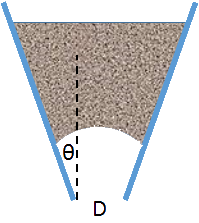
Getting particles to flow through a hopper can be difficult. A relatively small outlet at the bottom would be more elegant to control, and a relatively shallow angle in the hopper would mean that for a given height it could hold more material. Yet we are often forced to have large outlets (diameter D in the diagram), otherwise the material jams into an arch, blocking the flow. Note that this is different from the observation that an orifice which is less than ~5x the particle size will tend to block as the 5 particles jam together. There is also a need to have steep walls. Without steep walls the powder only flows in the middle ("funnel flow") rather than across the full width of the hopper ("mass flow").
To further complicate matters, although conical hoppers are generally more convenient, "plain-" or "wedge-"shaped hoppers tend to jam less easily so are sometimes necessary, even though this means that the contents pour out in a wide line rather than a round heap.
 Clearly particle-particle and particle-wall
adhesion are both important. But a powder is so complex that in reality measurements are made of
friction coefficients as these can be measured relatively easily. As is well-known, a friction coefficient η can be expressed in terms of the angle φ needed for something to slide down a plane (η=tan(φ)) and so the powder handling world tends to talk of friction in terms of "wall angles". So one condition for mass flow is that the hopper angle θ (or, rather, 90-θ because θ is defined so that θ=0 for a vertical wall) should be slightly greater than the measured "wall friction angle" φ.
Clearly particle-particle and particle-wall
adhesion are both important. But a powder is so complex that in reality measurements are made of
friction coefficients as these can be measured relatively easily. As is well-known, a friction coefficient η can be expressed in terms of the angle φ needed for something to slide down a plane (η=tan(φ)) and so the powder handling world tends to talk of friction in terms of "wall angles". So one condition for mass flow is that the hopper angle θ (or, rather, 90-θ because θ is defined so that θ=0 for a vertical wall) should be slightly greater than the measured "wall friction angle" φ.
There is a further complication. The particles themselves stick together or, equivalently, have a coefficient of friction. If there is some significant degree of attraction between the particles (especially if they are moist - see the capillary adhesion calculations) then this coefficient of friction will be higher than that with a surface. This in turn means that the equivalent angle (in terms of sliding down a plane) is higher. It seems odd to talk of an "internal angle of friction", δ, but mathematically it is helpful because the wall friction angle φ is itself so important. For very free-flowing powders, δ and φ are close. Tests give one more parameter τ which is the yield shear stress, or "cohesion coefficient".
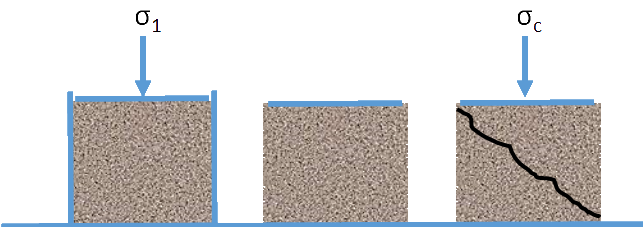 Unfortunately, life is even more complicated than that. The compaction of a powder under pressure (e.g. under its own weight in a hopper) has an effect on a powder's compressive strength - the stress needed for it to break under pressure. To understand hopper flows you need to know the size of the compressive strength at all relevant degrees of compaction. One way to do this is to compress some powder in a cell with a stress σ1, then to remove the walls around the sample so it is free-standing, and then push on the surface of the column of powder to find the stress σc at which it fails - which is the compressive strength. Such an experiment is easy to understand but hard to do because for each value of σ1 you have to start off with a fresh sample of powder.
So the powder community uses a more indirect method. They measure the shear stress necessary to break the powder which has been compacted under a known load. This can be done in a Jenike box which is able to slide along its middle, or in a ring shear cell, a rather more convenient device. Unfortunately, shear testers only measure shear and we want compression! Fortunately via a series of tests done on a single powder sample but under many different compaction loads, and tested at loads up to those compaction loads (it's a lot of data!), it is possible to extract σ1 and σc via "Mohr Circle" techniques which need not detain us here.
Whether done directly (which is unlikely) or indirectly (more usual), the result is a graph of σc versus σ1. The graph here uses a 3-parameter non-linear version to describe the curve where E and F are in kPa and q is a power dependency. These values are used in the calculation below of the minimum diameter Dmin to avoid blocking.
Particle Failure Stresses
We can gain a key bit of information from this curve. From the slope of the curve a Flow Factor (FF) can be calculated. The larger it is, the easier the flow of the powder. Values above 4 are "easy flowing" above 10 the powder is "free flowing". For a non-linear curve FF varies, of course, so it is calculated at 25% and 75% of the maximum σ1, with the value at higher compaction generally being higher (better flow), which is non-intuitive.
Now we have all but one the key parameters. We need to add the density of the powder in the hopper. Of course this density depends somewhat on the powder's self-compaction (see below) but is generally taken as a constant in these estimations, presumably measured under a "representitive" degree of compaction. Now, given all these parameters, how does one calculate a minimum outlet size for a hopper for a given wall angle θ? There is a vast literature of different methods, each claiming to be more elegant and accurate than the others. The results, after a few decades of debate, seem to be that they all more-or-less give the same answer, and the answer is pessimistic by a factor of 2; in other words, if they say that the minimum outlet diameter Dmin should be X, in reality the flow is OK (no arching) for an outlet of X/2. Out of interest I've provided two answers, Mróz & Szymański (M&Z) and Arnold & McLean (A&M). The formulae for each are complex and I've used the two Drescher papers1 (and the non-linear IYLs based on E, F, q) to help me through the algebraic maze.
Particle Flow Minimum Diameter
Compaction
All powders can compact on tapping, vibrating or pushing in some controlled manner. It is useful to be able to compare the compaction behaviour of different powders. One quick number is Carr's compressibility index
`C=100(ρ_t-ρ_b)/ρ_t = 100(V_b-V_t)/V_0`
i.e. the % compression between the bulk density ρb and the tapped density ρt, or, equivalently, the respective Volumes. The transition from freely-flowing to non-freely-flowing is ~C=20%. An even simpler ratio is the Hausner Ratio H
`H=ρ_t/ρ_b = V_b/V_t`
However, a single number gives no idea of the real behaviour. So it is usual to look at Kawakita or Heckel plots. It is arguable that they are much the same thing, though different communities tend to prefer one over the other.
Kawakita
For an applied pressure P the observed compaction
`C=(V_0-V)/V_0`
is given by
`P/C=1/(ab)+P/a`
where a and b are fitted constants. a is nominally equal to the original porosity ε0 but the meaning of b (dimensions 1/stress) is unclear.
Heckel
Given a starting porosity ε0 and measured porosity ε at pressure P,
`ln(1/ε)=ln(1/ε_0)+KP`
where K is a fitting parameter and 1/K is equal to the yield pressure Py or to 3σ0, the yield strength. Instead of porosity ε it is common to use 1-D, where D is the relative density = ρ/ρsolid compared to the pure solid.
Kawakita
and Heckel
From my observations of the literature, it seems to make sense to always plot
both Kawakita
and Heckel. They seem to reveal different/complementary aspects of a powder's behaviour and using just one seems to miss out on insights from the other. My intention at this point is to add some curves from some high-quality data in the literature obtained on some representative powders. But first I must get the authors' permission!