Adhesibility
Quick Start
If we have treated or prepared a surface, it would be really good if we could find an objective measure of whether our other stuff will stick to it; its "adhesibility". Although this notion is still not common, it is obvious to me that via JKR-style hysteresis experiments using nanoindenters we can make a lot of progress in understanding adhesibility.
Nanoindenter Adhesibility Testing
"Adhesibility" is not a common concept in adhesion science. But maybe it should be. The idea for this section came from a reader of Practical Adhesion who wanted a good test for the effectiveness of corona treatment. The app is described once the theory has been discussed.
As you now know, the fact that the surface energy of PE increases after corona treatment is irrelevant to real adhesion. Going from 30 to 45 mJ/m2 isn't going to give adhesion of J/m2, nor (usually) does the extra oxygen functionality make much difference. Instead, corona opens up the PE to allow intermingling and entanglement. Without opening-up of the polymer structure the adhesibility of the PE will remain low. But if it is opened up too much to create rubble the adhesibility will be low for different reasons - the surface rubble will detach easily. And if the surface was opened up some weeks ago but has had time to re-heal itself (form crystalline domains) then adhesibility will have decreased - the great nightmare for those who purchase corona-treated substrates.
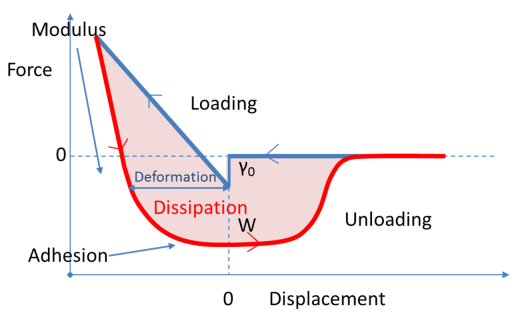 It seems logical, then, to test for adhesibility by testing for the ability of the surface to intermingle - in other words to show levels of adhesion far beyond 45 mJ/m2. Given a nanoindenter (it is generally agreed that AFMs are too delicate to measure significantly interesting adhesion) with a suitably "open" and "compatible" spherical probe material, an excellent adhesibility test would become possible. The Force/Displacement curve gives us lots of information, as shown in the diagram: modulus, adhesion, deformation and dissipation. What a lot of information from one experiment! And so much more insightful than the indirect information from contact angles. Rubble, for example, would show an identical loading curve (or somewhat higher because of a high surface energy) but the unloading curve would require very little force to pull the rubble off the surface.
Imagine, therefore, a box of standard spheres of a non-crystalline polymer chemically compatible with PE. Take a fresh sphere, attach it to your nanoindenter and measure the loading curve. Now hold it there for a known time against the treated PE. Now unload. From the loading curve the pure surface energy effects can be identified. From the unloading curve it will rapidly become clear if the adhesion is in the <100 mJ/m2 range which means that there is very little intermingling and therefore that the PE is insufficiently open, or whether there is a big displacement between the curves, indicating lots of intermingling and therefore an "adhesible" surface. It also seems likely that an overtreated "rubble" surface would show a strange unloading curve, perhaps with very sudden failure long before the classic pull-off expected from good adhesion. With some experimentation with deliberately under- and over-treated PE it should become easy to identify test conditions that correlate well with good adhesibility. As we know that adhesion depends also on dissipation which can be identified/characterised by the speed-dependence of the unloading curve, with strong dissipation requiring a much larger unloading force at high speeds.
The app
The app is a simplified representation based on standard conversions1 of the JKR width versus load curve to a displacement versus load curve. The loading (up to your chosen maximum Pmax) and unloading curves are defined by the two works of adhesion, pure surface energy Wsurf and the adhesive value Wadh. The radius and modulus of the rubber sphere are also set. It is famously the case that defining 0 for these nanoindenter experiments is tricky, so a simple δ0 offset is provided to match the experimental curve.
The extra information such as dissipation is not included in the app. If the unloading curve is strongly unloading-rate dependent then that will be evidence of dissipation. That would be a bonus indication of adhesibility!
Adhesibility versus Surface Energy
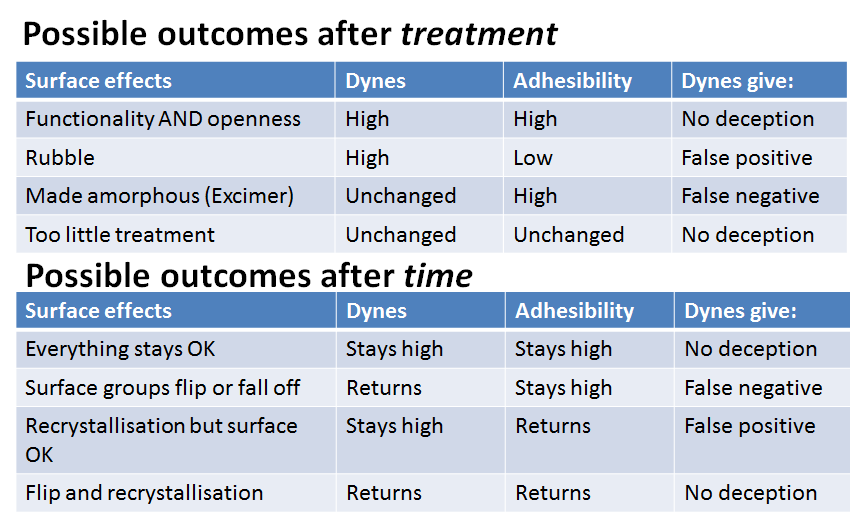 We can see the importance of an adhesibility test compared to a standard surface energy test. Depending on the effects of treatment and/or time, the adhesibility test always gets things right, the dynes are often wrong. Of course, nanoindenters aren't generally seen as day-to-day QC tools. But analytical tools partly reflect the market opportunity. A "good enough" nanoindenter whose main role was testing adhesibility would be very different from a pure research nanoindenter and the costs could become attractive.
At the time of writing, the above is mostly speculation. However, a marvellous paper from the Israelachvili group2 using SFA shows clearly that the adhesibility (though the authors don't call it that) of polystyrene beads is small (they are mostly crystalline), can be made smaller by UV cross-linking (under nitrogen) any dangling tails and can be made significantly larger by UV opening of the structure under oxygen. If any reader has any further information for or against the idea I will be delighted to update this page.
1Kenneth R. Shull, Contact mechanics and the adhesion of soft solids, Materials Science and Engineering R 36 (2002) 1–45.
2Nobuo Maeda et.al., Adhesion and Friction Mechanisms of Polymer-on-Polymer Surfaces, Science, 297, 2002, 379-382.