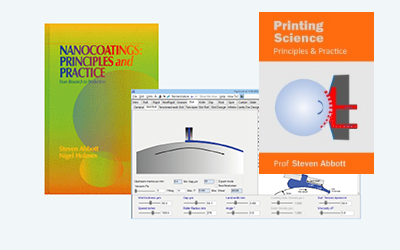
Dot Simulation
Quick Start
This is a basic simulation of what happens when idealised inkjet drops land on a surface and spread to an equilibrium contact angle - leaving out drop-to-drop interactions. The implications for the visual appearance and the printed optical density are significant.
Credits
Thanks to Neil Chilton at Printed Electronics Ltd in the UK who first showed me why these issues are important to real-world printing.
Dot Size
//One universal basic required here to get things going once loaded
window.onload = function () {
    //restoreDefaultValues(); //Un-comment this if you want to start with defaults
    Main();
};

//Main() is hard wired as THE place to start calculating when inputs change
//It does no calculations itself, it merely sets them up, sends off variables, gets results and, if necessary, plots them.
function Main() {
    //Save settings every time you calculate, so they're always ready on a reload
    saveSettings();

    //Send all the inputs as a structured object
    //If you need to convert to, say, SI units, do it here!
    const inputs = {
        V: sliders.SlideV.value / 1e15, //pl to m3
        theta: sliders.Slidetheta.value * Math.PI / 180, //Deg to rad
        DPI: sliders.SlideDPI.value,
        OD: sliders.SlideOD.value,
        HatOD: sliders.SlideHatOD.value * 1e-6, //μm to m
    };

    //Send inputs off to CalcIt where the names are instantly available
    //Get all the resonses as an object, result
    const result = CalcIt(inputs);

    document.getElementById('DDrop').value = result.DDrop;
    document.getElementById('DDot').value = result.DDot;
    document.getElementById('HDot').value = result.HDot;
    document.getElementById('SDot').value = result.SDot;
    document.getElementById('OverlapG').value = result.OverlapG;
    document.getElementById('OverlapD').value = result.OverlapD;
    document.getElementById('PercS').value = result.PercS;
    document.getElementById('PercD').value = result.PercD;
    document.getElementById('PercO').value = result.PercO;
    document.getElementById('OD').value = result.OD;

    //You might have some other stuff to do here, but for most apps that's it for Main!
}

//Here's the app calculation
//The inputs are just the names provided - their order in the curly brackets is unimportant!
//By convention the input values are provided with the correct units within Main
function CalcIt({ V, theta, DPI, OD, HatOD }) {
    const cost = Math.cos(theta), sint = Math.sin(theta)
    //The basic calculations
    DDrop = Math.pow(V * 6 / Math.PI, 0.333)
    const r = 3 / Math.PI * Math.pow(V / ((2 + cost) * Math.pow(1 - cost, 2)), 0.333)
    const HDot = r * (1 - cost)
    const DDot = 2 * Math.sqrt(HDot * (2 * r - HDot))
    const SDot = 1e-3 / (DPI / 25.4)
    const OverlapG = DDot / SDot
    const OverlapD = DDot / (SDot * Math.sqrt(2))

    //Graphics stuff
    const dpr = window.devicePixelRatio || 1;
    const theCanvas = document.querySelector('canvas')
    const ctx = theCanvas.getContext('2d')//setupCanvas(theCanvas, dpr);
    //const w = Math.floor(theCanvas.width / dpr), h = Math.floor(theCanvas.height / dpr)
    const w = theCanvas.width, h = theCanvas.height
    //We need to convert from metres to pixels for the graphics calculations
    const mtopix = SDot / h
    const offs = (r - HDot) / mtopix

    //Set up the rectangle
    ctx.beginPath();
    ctx.fillStyle = "white"
    ctx.strokeStyle = "white"
    ctx.lineWidth = 0
    ctx.rect(0, 0, w, h);
    ctx.strokeWidth = 0
    ctx.fill();
    ctx.stroke()

    const ws = (w - h) / 2
    let i, i1, j, j1, y, hv
    const rc = h * r / SDot //Ratio of radius to spacing which is defined as h
    const rc2 = rc * rc
    const HatODpx = HatOD * h / SDot

    let ODv = Array(h).fill(0).map(() => Array(h))
    for (i = 0; i < h; i++) {
        for (j = 0; j < h; j++) {
            ODv[i][j] = 0
        }
    }
    let dCount = 0, overlap = false
    //The code could be more efficient, but it's fast & simple to understand
    for (i = 0; i < h; i++) {
        i1 = h - i
        for (j = 0; j < h; j++) {
            j1 = h - j
            overlap = false
            if (i * i + j * j <= rc2) {
                y = Math.sqrt(rc2 - i * i - j * j)
                hv = y - offs
                if (hv > 0) {
                    ODv[i][j] = Math.max(hv / HatODpx, 0)
                }
            }
            if (i1 * i1 + j * j <= rc2) {
                y = Math.sqrt(rc2 - i1 * i1 - j * j)
                hv = y - offs
                if (hv > 0) {
                    if (ODv[i][j] > 0) overlap = true
                    ODv[i][j] += Math.max(hv / HatODpx, 0)
                }
            }
            if (i1 * i1 + j1 * j1 <= rc2) {
                y = Math.sqrt(rc2 - i1 * i1 - j1 * j1)
                hv = y - offs
                if (hv > 0) {
                    if (ODv[i][j] > 0) overlap = true
                    ODv[i][j] += Math.max(hv / HatODpx, 0)
                }
            }
            if (i * i + j1 * j1 <= rc2) {
                y = Math.sqrt(rc2 - i * i - j1 * j1)
                hv = y - offs
                if (hv > 0) {
                    if (ODv[i][j] > 0) overlap = true
                    ODv[i][j] += Math.max(hv / HatODpx, 0)
                }
            }
            if (overlap) dCount++
        }
    }
    let tAbs = 0, oCount = 0
    let id = ctx.getImageData(0, 0, w, h);
    let pixels = id.data;
    for (i = 0; i < h; i++) {
        for (j = 0; j < h; j++) {
            pix = Math.max(Math.floor(255 * (1 - ODv[i][j])), 0)
            k = 4 * (i + ws + j * w)
            pixels[k] = pix; pixels[k + 1] = pix; pixels[k + 2] = pix
            if (ODv[i][j] == 0) oCount++
            //Convert OD to absorbed fraction
            tAbs += 1 - 1 / Math.pow(10, OD * ODv[i][j])
        }
    }
    ctx.putImageData(id, 0, 0)
    const count = h * h
    tAbs /= count
    //Now convert absorbed fraction average to OD
    OD = -Math.log10(1 - tAbs)
    PercS = 100 * (count - dCount - oCount) / count
    PercD = 100 * dCount / count
    PercO = 100 * oCount / count
    //Return the values
    return {
        DDrop: (DDrop * 1e6).toFixed(1),
        DDot: (DDot * 1e6).toFixed(1),
        HDot: (HDot * 1e6).toFixed(1),
        SDot: (SDot * 1e6).toFixed(1),
        OverlapG: OverlapG.toFixed(2),
        OverlapD: OverlapD.toFixed(2),
        PercS: PercS.toFixed(1),
        PercD: PercD.toFixed(1),
        PercO: PercO.toFixed(1),
        OD: OD.toFixed(2),
    };
}
Small open areas give large reductions in OD
Suppose you had a thick ink coverage that should give an optical density (OD) of 3, absorbing 99.9% of the light. But 5% of the area has no ink because of problems with the dots. The effective light absorption is 94.9% which translates to `OD=-log_(10)(1-0.949)` which is 1.3. So small gaps between dots matter. It also means that if you had used 2/3 the ink so the total absorption was OD=2, i.e. 99% of the light, the resulting OD would `OD=-log_(10)(1-0.94)` which is 1.22. So 1/3 of your ink is providing 0.07 extra OD. If the 2/3 ink had been used to cover up the holes and decreased the total thickness by 5% then the OD would be 1.9. So, getting the most OD for your ink requires knowledge of where it's going, and fixing any obvious unprinted areas.
Spherical caps
You know the drop volume V Drop you are producing (the app, for convenience calculates the drop diameter D Drop) and you can use an estimate of the contact angle of the drop θ to calculate, via tedious spherical cap geometry (see Wiki Spherical Cap), the dot diameter D Dot and maximum height H Dot. The app shows 4 quarter dots spaced according to (scaled by) the input Print DPI. For the same size drop, if you increase Print DPI the relative size of the printed dot increases
The thickness, and therefore the OD of the dots, is highest at their centres and falls to zero at their edge. If you decrease the contact angle θ then the dot gets larger so H Dot decreases and the OD decreases. So we start to see some trade-offs, better spreading reduces the absorption at any give position in the dot. Eventually the spreading dots start to overlap, giving larger OD at the overlaps. [Note that we are just exploring the core geometry, we are ignoring dot-on-dot spreading].
Covering up the open areas
Although increasing dot diameter decreases the OD in the dot, it is also decreasing the amount of open area, so the overall OD generally increases. Once you have overlapped significantly at the centre, you get diminishing returns because ink-on-ink is less effective than ink-on-white. Doubling the thickness of a layer OD=1 gives OD=2 but you've gone from 90% to 99% absorption - not a big return for an extra layer of ink. Doubling the thickness of OD=0.5 to OD=1, takes you from 68% to 90% absorption - a bigger effect for less ink.
Calculating the OD
You must first provide a Ref OD which is the OD of a reference film of a constant height Ref H. You could, for example, make a drawdown of thickness H and measure the OD. Given this, then the OD at all parts of the dots is calculated based on the thickness calculated from spherical cap geometry and from any overlaps.
The output tells you what fraction the dot diameter is of the grid spacing (Overlap - Grid) and of the diagonal spacing (Overlap - Diagonal) which is the bigger challenge. The output also provides the % covered by isolated, Single layers by Multiple layers and by Open areas. At each point the thickness, and therefore the OD is known so we calculated the % light absorbed. By summing these values and taking the average we know the average absorption which can be converted to the effective OD of the print.
Drop volume effects
Although there are plenty of simplifying assumptions, you will find that the app is insightful. There are two ways to increase the OD of the final print.
- Increase the DPI at a fixed drop volume
- Increase the drop volume at a fixed DPI
Each approach has its advantages and disadvantages. The app lets you explore them so you can better think through your print strategy.