Levelling
Quick Start
ThIt is common for coatings to start out with regularly-spaced defects from the coating process or paintbrush. Fortunately, many of these defects level out before drying. The app shows that the levelling time depends weakly on surface tension σ and viscosity η, strongly on thickness, h, and very strongly on the defect wavelength λ. So if you want fast-levelling, focus on h and λ before worrying about σ and η!.
Levelling
//One universal basic required here to get things going once loaded
window.onload = function () {
    //restoreDefaultValues(); //Un-comment this if you want to start with defaults
    Main();
};

//Main() is hard wired as THE place to start calculating when inputs change
//It does no calculations itself, it merely sets them up, sends off variables, gets results and, if necessary, plots them.
function Main() {
    //Save settings every time you calculate, so they're always ready on a reload
    saveSettings();

    //Send all the inputs as a structured object
    //If you need to convert to, say, SI units, do it here!
    const inputs = {
        h: sliders.Slideh.value/1e6,
        lambda: sliders.Slidelambda.value / 1e6/(2*Math.PI),
        Visc: sliders.SlideVisc.value/1e3,
        Vmax: sliders.SlideVmax.value/1e3,
        ST: sliders.SlideST.value/1e3,
        tmax: sliders.Slidetmax.value,
    };

    //Send inputs off to CalcIt where the names are instantly available
    //Get all the resonses as an object, result


    const result = CalcIt(inputs);

    //Set all the text box outputs
    document.getElementById('LT').value = result.LT
    //Do all relevant plots by calling plotIt - if there's no plot, nothing happens
    //plotIt is part of the app infrastructure in app.new.js
    if (result.plots) {
        for (let i = 0; i < result.plots.length; i++) {
            plotIt(result.plots[i], result.canvas[i]);
        }
    }

    //You might have some other stuff to do here, but for most apps that's it for Main!
}

//Here's the app calculation
function CalcIt({ h,lambda, Visc, ST, tmax,Vmax }) {
    let Ptsh=[],ts,ht
    const t0 = 3 * Visc * Math.pow(lambda, 4) / (ST * h * h * h)
    const Vdiff=Math.max(1,(Vmax-Visc)/Visc)
    let t=t0
    let LT=(t*1e6).toPrecision(3)+"μs"
    if (t>=1e-3 && t<1)LT=(t*1e3).toPrecision(3)+"ms"
    if (t>=1 && t<1000) LT=(t).toPrecision(3)+"s"
    if (t>=1000)  LT = t.toPrecision(5)+"s"
    for (ts=0;ts<=tmax;ts+=tmax/100){
        //The "fluidity" correction from Overdiep
        t=t0*(1+ts/tmax*Vdiff/2)
        ht=Math.exp(-ts/t)
        Ptsh.push({x:ts,y:ht})
    }

    const plotData = [Ptsh]

    const lineLabels = ["d dependence at chosen wavelength λ"]
    const lineLabels1 = ["λ dependence at chosen particle size d"]
    const myColors = ["blue"]
    const myColors1 = ["orange"]
    const borderWidth = [2]

    //Now set up all the graphing data detail by detail.
    const prmap = {
        plotData: plotData, //An array of 1 or more datasets
        fontSize:20,
        lineLabels: lineLabels, //An array of labels for each dataset
        colors: myColors, //An array of colors for each dataset
        hideLegend: true,
        borderWidth: borderWidth,
        xLabel: 't&s', //Label for the x axis, with an & to separate the units
        yLabel: 'Relative Amplitude&', //Label for the y axis, with an & to separate the units
        y2Label: null, //Label for the y2 axis, null if not needed
        yAxisL1R2: [], //Array to say which axis each dataset goes on. Blank=Left=1
        logX: false, //Is the x-axis in log form?
        xTicks: undefined, //We can define a tick function if we're being fancy
        logY: false, //Is the y-axis in log form?
        yTicks: undefined, //We can define a tick function if we're being fancy
        legendPosition: 'top', //Where we want the legend - top, bottom, left, right
        xMinMax: [,], //Set min and max, e.g. [-10,100], leave one or both blank for auto
        yMinMax: [0,1], //Set min and max, e.g. [-10,100], leave one or both blank for auto
        y2MinMax: [,], //Set min and max, e.g. [-10,100], leave one or both blank for auto
        xSigFigs: 'F0', //These are the sig figs for the Tooltip readout. A wide choice!
        ySigFigs: 'F2', //F for Fixed, P for Precision, E for exponential
    };

    //Now we return everything - text boxes, plot and the name of the canvas, which is 'canvas' for a single plot
    return {
        plots: [prmap],
        canvas: ['canvas'],
        LT:LT
    };
}
 A coating will often contain some sort of line defect visible at the coating head but invisible once dry. As the wet coatweight is reduced the same wet defect now shows up in the dry coating. Why? Because the defect has not had time to level out. The reasons for this are not obvious until Orchard levelling theory is invoked.
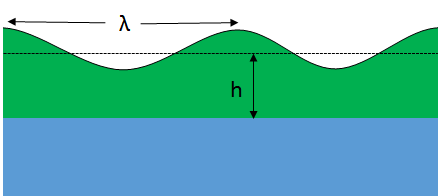
The levelling time te down to 1/e for a defect of wavelength λ in a coating of thickness h with viscosity η and surface tension σ is given by:
`t_e=(3η(λ/(2π))^4)/(σh^3)`
We can plot this over a timescale of tmax. The relative amplitude at at time t depends on that te. But suppose your coating's viscosity increases with time. For simplicity you specify the viscosity at tmax, ηtmax which, assuming a linear dependence, produces at time t: `"Δη"_t=η_t-η_0`. The effective teff increases over time according to a "fluidity" which is, in this case `η_0+"Δη"_t/2`, so we get
`a_t=exp((-t)/t_"eff")`
Although the viscosity effect is significant, it immediately becomes clear that relatively small decreases in thickness can give a large increase in levelling time because of the h3 term. On the positive side, increasing the sharpness (decreasing λ) of the defect greatly decreases levelling time. That's why those who buy cheap paint brushes with coarse bristles (large λ) have to put on more paint (larger h) than those who buy better brushes with finer bristles.
As seen in the Pinholes app, thin coatings also tend to make pinholes worse, so life is tougher for nanocoaters.
It's not so simple
The idea of using a finer brush is a good one, but it's not the end of the story. Many "brush strokes" and marks from rollers are not dependent on the brush or roller directly but on the complex phenomenon of "ribbing". If you apply paint with, say, a roller with a small gap (high pressure), slowly, and with a low viscosity paint, you get a smooth coating; but as you go a bit faster or larger gap or higher viscosity you start to get lines. As they are relatively far apart, they take a long time to flow out. If you go very fast, with a high viscosity paint you will get lots of lines, closely spaced, which can flow out faster.
Although the physics of this is well-known for coating with smooth rollers in coating machines, I don't know a good way to translate that to paint brushes and rollers.
Linking to rheology
The formula assumes you know the viscosity. For coatings which are high viscosity at low shear rate or shear stress, it's hard to know which value to use. The science of sag (using the Anti-Sag Index technique) has been related to low-stress rheology measurements. Levelling must also be describable by such a technique but I've not yet found a relevant formula. Explore more in the Levelling & Sag app.