
Thin Film Modeller
Quick Start
If you have a layer or two in the nm to low μm thickness range, and if their refractive indices are different from the bulk medium, then you get complex interference effects that can give you (un)desirable colours or, sometimes, desirable anti-reflection properties.
The app is relatively tedious to use, without neat sliders. But it's a "professional grade" model that allows you to take into account many factors.
To get a feel, just play with the thickness and RI of the first active layer. Or perhaps first go to the Interference app where there is a friendly single-layer model.
Thin Film Modeller
| # | RI | nm | # | RI | nm | # | RI | nm |
| 1: | 2: | 3: | ||||||
| 4: | 5: | 6: |
| RI-Top | RI-Sub | Disp. | Phot. | ||
| Angle | λMin | λMax | |||
 The reflection of light from a surface depends on the wavelength and angle of the light as well as the properties of the surface. In particular, if the surface is a base substrate with 1 or more layers on top then the reflection has a complicated dependence on the optical properties and thicknesses of all the active layers.
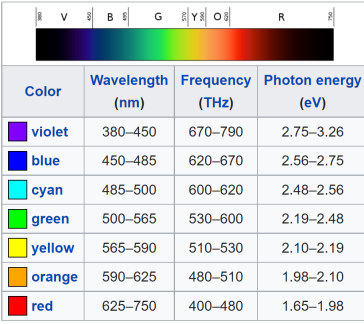
This handy image from Wikipedia gives you an idea of what colour you will see if the reflection spectrum is dominated by a single peak.
The TFM allows you to enter the refractive index (RI) and thickness of between 1 and 6 layers on top of a substrate. The RI of the entry medium (typically air RI=1) and the substrate (e.g. glass RI=1.5) can also be varied.
A full optics program takes into account both the real (standard RI) and imaginary (k - the absorbance) values of the materials but for simplicity the calculations use just the real component.
Inputs and Outputs
Simply enter the RI and thickness (in nm) values for any of the layers and turn them on and off with the selectors. You can also vary the RI of the incoming medium (RI-Top) and the substrate (RI-Sub). The basic outputs in addition to the graphical values are the Integral reflectivity, the Photopic reflectivity (see below) and DeltaR, the difference between RMax and RMin. The calculation updates automatically each time any variable is changed.
The minimum and maximum wavelengths (λMin and λMax) can be set for as narrow or as broad a range as you wish.
Because thicknesses of λ/8, λ/4 and λ/2 (defined at 550nm) have specific optical properties, the three buttons allow you to set your selected layers to those values. As a specific example, take a base substrate of RI=1.5, a layer 1 with RI=1.5 and layer 2 with RI=1.8, click the λ/4 button and you will find a near-perfect AR performance at the photopically optimum wavelength of 550nm.
At an angle of 0° one line appears in the graph. Moving the mouse over it reveals the wavelength and %R. At higher angles 3 lines appear. The top is the s-polarized light, the bottom is the p-polarized light and the one in the middle is the average.
Turning on the Photopic option calculates the reflection visible to the human eye. The sensitivity of the eye falls off rapidly either side of 550nm. So worrying about a high %R at, say, 400nm, is perhaps not important as the eye sees almost none of the reflected light at that wavelength. The integrated reflectivity is calculated both over your chosen range and the photopic range.
The basic calculation assumes that the RI values are constant across the wavelength range. Selecting the Dispersion option generates a typical variation of RI with wavelength - this is for illustrative purposes only. No attempt is made to provide Cauchy dispersions.
The sage advice from Rick Spencer of Alacritas leading to a much-improved layout of the "stack" is gratefully acknowledged.