
Cross-Linking by UV
Quick Start
This is a major app. It tells you what is going on inside a UV crosslinking system made of multiple ingredients with different functionalities, though at least one of them should be mono-functional.
Cross-linking UV
The app assumes you have a UV curing system with a collection of reactive species with 1, 2, 3... reactive groups. (A different app looks at the overall UV curing process.) It is a limitation of my understanding of the theory that there should be at least some monofunctional group present.
Thanks to the magic of the Miller-Macosko (MM) approach1, this is all easily calculable. Well, not "easily" for me as I simply could not work it out. Fortunately, Prof Georg Meichsner from Hochschule Esslingen had written a paper2 that greatly helped me to understand the original MM and provided a test case that I could use to validate the code. It is the default FL-TMPFMA-HDDA example on startup. I am most grateful for his kind help.
First, play with the examples (you can create your own as described below). The names don't mean much but some of them are literature examples I used to validate the app. Each has a mixture of 1, 2 ... functionalities and you can explore the various outcomes. The q value is the ratio of propagation rate to the sum of all rates including the various termination rates. A typical value is 0.98 and you can alter it from the pessimistic 0.90 to optimistic 0.999.
You get some output values plus some graphs
- The Gel Point, which is usually very small
- The % soluble fraction as conversion continues
- A measure of the crosslink density, discussed below
- Graphs of how much of each of 4 of your chosen functionalities exist as the cure progresses, discussed below.
- Optionally a graph showing the theoretical Tg at a given % conversion, discussed below.
X[m,f] is the nomenclature used by MM for describing how much reacted functionality, m, exists of each group with total functionality f. Flory, MM and others define f=2F where F is the "normal" functionality. So HDDA is a di-functional acrylate, so F=2 but f=4. X[3,4) means an HDDA where there is a full chain going into and out of one of the acrylates but only a chain going in with, so far, no chain going out of the other acrylate. These X[m.f] values can be readily calculated, but as there can be lots of them they are restricted to your choice of f (from 4 to 12), with m= f-3,f-2, f-1, f. So if you are interested in your 4-functional reactants you select X=8 and see how much 5- 6-, 7- and 8-functionalised material there is. [The app won't let you enter an f value greater than your largest functionality].
The Links output is something like a cross-link density. See Cross-linking for a proper explanation. For convenience the graph is normalized to the density you'd get if you had 100% conversion with q=1, which is shown as Max X-Link. The units are deliberately vague but are some sort of molar concentration. The mouse readout gives the absolute value.
Show Tg
The Stutz equation used in the X-Link-Tg app shows that Tg depends on % conversion, the crosslink density and a couple of other parameters. The calculation has been included, with K2=0.8 for simplicity.
The motivation for including it is the fact that the calculatted gel point is very low, but experimentally, the viscosity/modulus only start increasing rapidly after, say, 25% conversion. The Tg curve may or may not explain this. If experts have other opinions, please let me know.
Not 100% conversion!
The app shows what happens up to 100% conversion. But of course, many reactions stop at a much lower % conversion because groups cannot move to find each other - unless you raise the temperature to allow more freedom to move.
It is important, therefore, to have a realistic idea of your % conversion and read off values at that % and ignore everything above it as irrelevant.
Your own examples
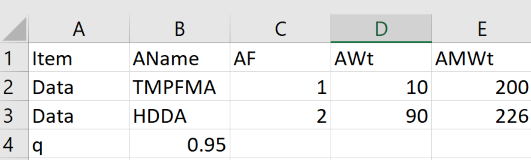 You can simply type entries into the tables, ignoring the intermediate results before you have entered everything. But if you wish to create a set of them then go into Excel, set up a first row with the following entries:
Item AName AF AWt AMWt
Then start each new row with Data, then add the self-explanatory values. To enter a starting value for q, start a new row with q (instead of Data) with the q in the next (AName) column. Save as a .csv file to your hard drive and click the Choose File (or equivalent name, it's browser dependent) to load it.
1 Douglas R. Miller and Christopher W. Macosko, A New Derivation of Post Gel Properties of Network Polymers, Macromolecules, 9, 1976, 206-211
2Georg Meichsner et al, Netzwerksgrößen UV-gehärteter Lackfilme, Farbe & Lack 103, 45-50, 1997