
Nanoclay Barriers
Quick Start
There was great hope that we could get some great barrier properties by adding nanoclays to coatings. In general those hopes have not worked out because the basic physics is not as promising as it seems at first.
See how the relative permeation depends on clay loading when you alter the aspect ratio and the order parameter S. Two models are provided - the simple Nielsen model and the slightly more sophisticated Gusev & Lusti model. The differences between them (and other variants) are probably less than the error in the assumptions such as the diffusion coefficient through the polymer matrix remaining constant. Prof Daniel Schmidt of LIST is thanked for introducing me to models beyond Nielsen.
Then go to the diagram at the bottom to see why even an apparently great barrier may not be so great after all.
Nanoclay Barriers
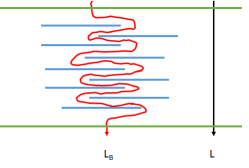 The attraction of nanoclays as barriers is obvious. They are essentially low-cost, "natural" particles with a high aspect-ratio (length/thickness) that are themselves near-perfect barriers and can align themselves to form a reasonably good barrier, with the only path through being the highly tortuous one shown - with a tortuosity of Lb/L.
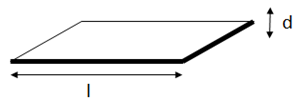 The rules for the effectiveness of the barrier are two-fold. The first is that the Aspect Ratio, AR=l/d, is of great significance. Spherical particles (AR=1) require a very high % of filler to create a good barrier. Really good clays (e.g. AR=5000) give a good barrier at low filler levels (reduce φmax in the plot to see more detail). If the average clay particle is two layers thick then d is twice what it should be and AR is halved - with a big effect on barrier properties.
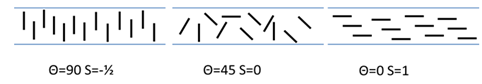 The attraction of nanoclays as The second rule is that the alignment of the particles is important. This uses the order parameter S which varies (for historical reasons) from -0.5 for vertical alignment (the angle Θ = 90), via 0 for random alignment (Θ = 45) to 1 for horizontal alignment (Θ = 0).
The graph shows you the relative permeation of the coating (assuming that the filler itself is a perfect barrier) as a function of % filler, depending on your choice of AR and S. There are many other factors in obtaining a reliable barrier such as the effect of moisture on the binder for the nanoclay and, of course, the thickness of the barrier which dictates the tortuosity. This simple app is concerned only with the effects of AR and S.
The basic equation is that the relative Permeability, P, depends on AR, S and the tortuosity, τ, via:
`P=(1-φ)/(1+0.666τ(S+0.5))`
The tortuosity is defined in the simple Nielsen equation (accurate only for "dilute" systems) as:
`τ=0.5AR.φ`
The Cussler equation works for "semi-dilute" systems and is:
`τ=0.66AR.φ +((AR.φ)/3)^2`
The Gusev & Lusti tortuosity, obtained by data fitting rather than analysis (you choose if this is an advantage or disadvantage) is:
`τ=e^[((AR.φ)/3.45)^0.71]-1`
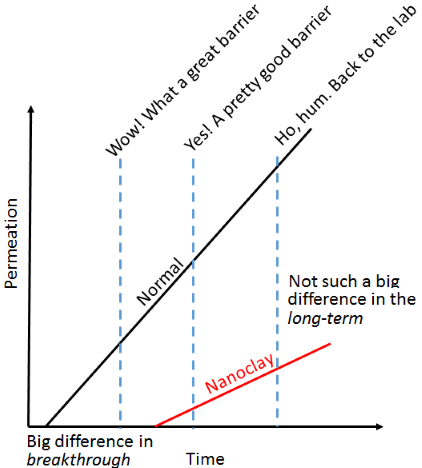 There is, unfortunately, a fundamental problem with nanoclay barriers. If you measure them over a short timescale they appear to be perfect. Measure them over a longer timescale and they seem to be OK, over an even longer timescale and they are actually not much good. Over the short timescale nothing has managed to thread its way through the tortuous path so it seems to be a perfect barrier. Eventually things start to get through and it becomes clear that the barrier has a big effect on
breakthrough time which might be desirable if the only issue is short-term performance. As the steady stream starts to come through, the cumulative amount is, of course, less than the alternative, but the
relative difference decreases over time. So the barrier changes from "perfect" to "OK" to "ho hum".
There is, unfortunately, a fundamental problem with nanoclay barriers. If you measure them over a short timescale they appear to be perfect. Measure them over a longer timescale and they seem to be OK, over an even longer timescale and they are actually not much good. Over the short timescale nothing has managed to thread its way through the tortuous path so it seems to be a perfect barrier. Eventually things start to get through and it becomes clear that the barrier has a big effect on
breakthrough time which might be desirable if the only issue is short-term performance. As the steady stream starts to come through, the cumulative amount is, of course, less than the alternative, but the
relative difference decreases over time. So the barrier changes from "perfect" to "OK" to "ho hum".