
Cross-Linking
Quick Start
This is a major app. It tells you what is going on inside a crosslinking system made of multiple components (epoxies, urethanes, polyols...) with different functionalities. The UV curing version is here.
Cross-linking
The app assumes you have some A-B reactive system such as epoxy-polyol, urethane-polyol or some sort of melamine system. [It also assumes that each group reacts at the same rate] You might have 100% of a 6-functional A and 100% of 2-functional B (in a 1:3 ratio) or you might have some 2-, 3-, 4-functional A's and 3-, 4- functional B's in any combination. What you want to know is how quickly it gels, how much soluble material remains and how much of each functionality is used up.
Thanks to the magic of the Miller-Macosko (MM) approach1, this is all easily calculable. Well, not "easily" for me as I simply could not work it out. Fortunately, Dr David Bauer from Ford provided a paper2 with computer code in the appendix and I was able to translate it from ancient command-line BASIC into modern Javascript.
First, play with the examples (you can create your own as described below). The names don't mean much but some of them are literature examples I used to validate the app. They each start with a closely-matched functionality of A:B and you can see what happens when you play with that ratio. Because the % Conversion axis is of A, if you have more A than B then the % Conversion stops when you have run out of B.
You get some obvious output values plus some graphs
- The A:B functionality ratio which generally should be close to 1
- The Gel Point
- The MWt at 1% conversion below the gel point. This isn't very meaningful, but gives an idea of what is happening.
- Plot of the MWt as a % of the recorded MWt. With the mouse over the graph you get the actual value.
- The % soluble fraction
- A measure of the crosslink density, discussed below
- Graphs of how much of each of 3 of your chosen functionalities exist as the cure progresses, discussed below.
X[m,f] is the nomenclature used by MM for describing how much reacted functionality, m, exists of each group with total functionality f. These values can be readily calculated, but as there can be lots of them they are restricted to your choice of f (from 3 to 6), with m=f-2, f-1, f. So if you are interested in your 4-functional reactants you select X=4 and see how much 2-, 3- and 4-functionalised material there is. The magnitude depends on the % 4-functional material at the start.
The Links values (use your mouse to read the values) are something like a cross-link density but are defined by MM in a way that I didn't understand until it was kindly explained to me by Daan Heskes. Here is his explanation.
- You take an initial molecule with functionality f and concentration A. And you multiply this with the probability that a number of m groups have reacted AND have linked to the (infinite)network this way.
- Once you have this you have the concentration of all groups with m-links to the network:
- m=0 : no links
- m=1: one link, i.e. chain stopper
- m=2: 2 links, i.e. chain extender
- m>=3: branching
- So for estimating the crosslink density we only need to take into account the concentration of m>=3. However the first two links don't count for branching, they are just extending the chain. So you need to substract 2 to count the total number of branches of the molecule.
- Since we are looking out of each molecule, every branch will have a connection with another branched molecule. To avoid counting the branching double you will need to divide by 2.
- For an f functional molecule with m links you get
- `v(m,f) = (A(f)P(m,f)(m-2))/2` for f,m>=3
- By summing up this partial crosslink density through all m and f you find the total crosslink density. This value you can then use to estimate some of the other properties of your system.
Not 100% conversion!
The app shows what happens up to 100% conversion of the A groups. But of course, many reactions stop at a much lower % conversion because groups cannot move to find each other - unless you raise the temperature to allow more freedom to move.
It is important, therefore, to have a realistic idea of your % conversion and read off values at that % and ignore everything above it as irrelevant.
Side Reactions (Self-Condensation)
Sometimes the B component can get involved in side reactions. Bauer included this effect ("self condensation") in his code and I've added the effect. If you happen to know about self-condensation (and, if I understand correctly, side reactions with water) then feel free to change the %B Side React. value.
Your own examples
 You can simply type entries into the tables, ignoring the intermediate results before you have entered everything. But if you wish to create a set of them then go into Excel, set up a first row with the following entries:
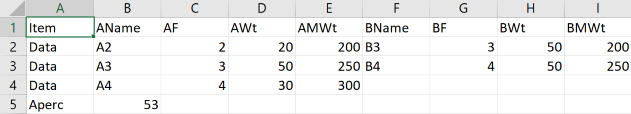
Item AName AF AWt AMWt BName BF BWt BMWt
Then start each new row with Data, then add the self-explanatory values, leaving blank values for A's or B's if you have more of one than the other. To enter a starting %A, start a new row with Aperc (instead of Data) with the percentage in the next (AName) column. Save as a .csv file to your hard drive and click the Choose File (or equivalent name, it's browser dependent) to load it.
1 Douglas R. Miller and Christopher W. Macosko, A New Derivation of Post Gel Properties of Network Polymers, Macromolecules, 9, 1976, 206-211
2David R Bauer, Calculating Network Structure Using Miller—Macosko Theory, ACS Symposium Series, Vol. 404, Computer Applications in Applied Polymer Science II, Chapter 18, pp 190–212, 1989