Bubble Size Analysis
Quick Start
The idea of using a picture of bubbles in contact with a prism to measure the size distribution came from Dr Peter Garrett of Unilever in 1993 and is widely adopted by the foam science community. With modern tech this can now be done more conveniently. For app convenience, the visible image is scaled, but a magnifier lets you look at relevant details.
Bubble Size Analysis
Background explanation
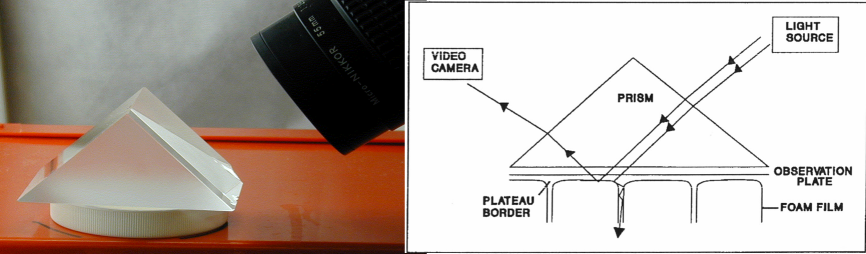 The idea is simple. Take a picture of the bubbles, using the black/white contrast obtained by contact with a prism, and automatically identify each true bubble in the image, count the number of pixels in that bubble, then calculate how the bubbles are distributed over various sizes. The image explaining the system is courtesy of Prof Nikolai Denkov's group at U Sofia.
It is often imagined that such an "image analysis" technique would be very difficult. In reality, there are two major difficulties that are nothing to do with fancy image analysis:
- Getting even lighting, with perfect black/white contrast between bubble and water. Any imperfection in the lighting makes it harder to distinguish bubbles from background or noise.
- Calibration is trickier than you might imagine. A pre-calibration requires you always to take the image from exactly the same distance with the same microscope focus/magnification. A calibration object in the image (a) takes space away from bubbles and (b) needs some mouse-based user identification or a smart algorithm to define.
For the calibration problem, the simple approach used here is that somehow you accurately know the full width in mm of your image. One trick is to take the bubble measurement then move the prism onto a convenient ruler with a mm scale and grab an image. You read off the number of mm across the full width of the image and enter that into the Width slider.
One further trick. It's not obvious from the image of the setup but the prism is set into the top of a plastic lid. Placing the lid onto the bubbles automatically (via the rim of the lid) levels the prism to minimize distortions. The lid also blocks stray light from around the bubbles, increasing contrast. Obviously the depth of the lid needs to be larger than the biggest of your bubbles, otherwise the bubbles will be badly distorted.
Size analysis
Load an image. With the Pic-only option selected you can get a good idea of the image quality. You now have to decide on a Threshold value. Anything less bright than this will be considered as a non-bubble, anything brighter will be a bubble. You can move your mouse around the image and get an RGBK value. The K (for blacK) is grey-scale value used to threshold. Move over a few bubble and get a feel for their K values (large) compared to the background (smaller). Then choose a Threshold value that safely includes your bubbles but excludes odd shadows, marks etc. - as best you can. If you click and drag the mouse over a bubble you will get an idea of its size, providing your calibration is correct.
If you have a noisy image with lots of few-pixel dots, set a Min-Pixels value of, say, 10, so that this noise is ignored. Of course this might exclude some real bubbles, so you need to reach a compromise value. Excluded small bubbles are coloured red. The Max-Pixels value can often be set to a medium value to be able to exclude things that are unexpectedly in the image. Set it too small and some real bubbles are excluded. Too large and some bit of junk will be included and generally reduce the worth of the calculations. Excluded large bubbles are coloured green The more perfect your lighting and image, the less you need to worry about these details.
The area across the middle of the image might often be better quality than nearer the top of bottom. If you slide the Ymin and Ymax sliders you will be able to choose an area between two red lines that appear. Bubbles outside those lines will be excluded from the analysis.
To analyze the sizes it is customary to place them into "bins". Everything from 0-10 μm might be in one bin, everything from 10 to 20 μm in another etc. N-Bins lets you choose. Too few and you don't get a sensible analysis. Too many and you probably don't have enough bubbles per bin for the data to make statistical sense.
Each time you change your inputs things are re-calculated automatically - speeds seem to be OK if you don't slide too wildly. You get NBubbles, the number of individual bubbles identified (within your Min-Max Pixels) and Max the largest one. This box is very useful. If you change Threshold or Min-Max Pixels over a reasonable range, and if these values remain not much changed then you are in a happy part of image analysis space where your measurements are way above any noise level from junk in the image. If the numbers change a lot then your final results depend on your judgement rather than hard numbers. The more time you devote to getting well-lit images with few artefacts, the less you will need to fiddle with the control variables.
The results
Suppose you have 99 bubbles each of diameter 1 and 1 bubble of diameter 100. You can correctly say "My bubbles are 99% size 1" and you might be very happy - till you look at the foam itself. Another way of thinking about it is to say that those 99 bubbles will have a volume of, say, 1 unit each so their combined volume is 99. Because volume depends on diameter³, the one large bubble will have a volume of 1,000,000. Therefore, in volume terms your 99 bubbles are insignificant and effectively you only have a single large bubble, which is not what you want!
So when we show the size distribution we could show it in Number terms, how many are at each diameter (or are in the bin with that diameter range). This matches our intuition when we look at the image - we see all those small bubbles and hardly notice the large ones. We can also show them in Area terms which expresses how much of the surface area comes from various bubble sizes. And we can show them in Volume terms which tells us where the volume of bubbles really lies. I've chosen to plot all three. We can also plot them in a cumulative manner so you can readily see at which sizes interesting things happen. Some like to see them in logarithmic scale. The arithmetic of the calculations is discussed below.
If you have a rogue large bubble, your top few bins might be empty, with a leap in the final (volume) bin. Decrease Max-Pixels below the Max value shown in the information box at the top. The rogue bin should disappear and your plot will look more sensible. Of course, if that rogue bubble is real and is of a significantly larger size then (as you will see in the cumulative volume plot) your foam will be dominated by that one large bubble!
Data on the Clipboard
Each time you analyse an image, the data are placed on the Clipboard in an Excel-pastable format. Most of the time you don't need this, but it's only the Clipboard so it doesn't matter. However, any time you want to record the data, just open Excel, do Ctrl-V to paste and it's all there.
Air volume fraction, φ
It is not possible to go from a 2D image to an accurate foam air volume fraction, but taking the cube root of the ratio of white to black pixels gives a reasonable approximation so you can compare different foams.
An even field of lots of bubbles
The app doesn't get tired of counting. So the more bubbles in the view, the better it is at getting good statistics. However, if bubbles are only a few pixels wide in the view, the errors in the measurements will be large. You also need the bubbles to be well-distributed to avoid systematic errors. As mentioned above, attaching your prism to a plastic lid which lightly presses down on the bubbles seems to be a good way to ensure an even, stable distribution, as long as you don't squash the bubbles too hard.
Your test rig
Ideally the light source should be fixed to one edge of the prism and the camera/microscope to the other. If, as suggested above, the prism is attached to something like a plastic lid then it is easy to find a bunch of bubbles and measure them straight away. If you have to manually position prism, light source and camera each time, life will be frustrating. You can buy telescope 90° prisms with attachements on each face, but you will somehow have to remove the bottom plate which seals the device for telescopes.
At the time of writing, I have no good information on suitable light sources. I think a collimated beam will be ideal, but I don't know a good source of collimated LED light that can readily be attached to a prism.
Your microscope or DSLR camera
With bubble size analysis, as with everything else, it's garbage in, garbage out. You can easily get a picture with a cheap USB microscope. The problem is that these microscopes often have "smart" software that autoadjusts image brightness and contrast to give what it thinks is a good image. They also have magnification and focus controls that interact so you cannot rely on the focus and field of view being constant from day to day. If you can tape up the focus/magnification to a standard fixed state, and if you can turn off automatic settings in the capture software, life will be good. If you can find a better USB microscope, so much the better.
A good DSLR with a macro attachment should also work, but it's hard to think how to make it conveniently portable (and immune to water/foam damage) for a live bubble-testing event.
The Calculations
All I know after the image processing is the number of pixels making up a "blob". I can call this an area, A, so I know that if this was a circle, the radius would be given by Α=πr². Now I have the pseudo-radius, r=√(A/π), of each blob. I can then say that the surface area of the bubble is 4πr² and its volume is 4/3πr³. This allows me, for each radius bin (though I plot it as the more comfortable diameter), to know the Number of bubbles in that bin, the Area of those bubbles and their Volume.
To report the results, for simplicity I give a Number, Area and Volume mean value to capture an "average". For those familiar with the topic, these values are D[1,0], D[2,1] and D[3,2]. There is also a D-x which you define as D90, D80 etc. via the slider. This is the diameter below which 90%, 80% etc. of the bubbles are found. Other "average" values are available and further options might be added later.
These foam size cumulative distributions can often be described well via a Weibull distribution (look it up on Wikipedia) or, with some equivalence, Rosin-Rammler (not provided). By selecting the Weibull option we get the two key parameters λ (more or less the half way point of the cumulative curve) and k (the sharpness of the curve - larger = sharper). We also get a Mean, Median and Variance (M-M-V). The fitted curve is provided in the graph so you can check if the calculated Weibull values are meaningful.