Phase Diagram Explorer
Quick Start
Phase diagrams are so useful, powerful and yet so hard to understand!
Start with this app to see what a ternary diagram is and how to interpret it, no matter which (confusing) way it's shown in a book or paper.
Once you've mastered the diagram, you can start to tackle real surfactants.
PDE
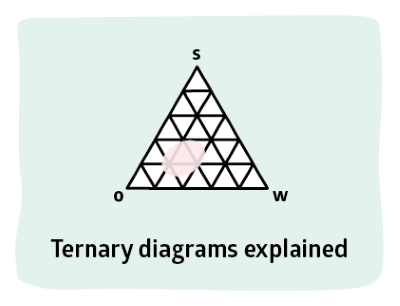 Nearly everyone finds phase diagrams confusing. PDE uses some typical surfactant phase diagram examples to build up your confidence in working with this important way to look through slices of complex systems. In PDE we have W(ater), S(urfactant) and X where X can be oil, polymer etc.
The first step is to get to know how to read the "same" diagram in different ways. Triphase diagrams seem specially designed to cause confusion to those who try to interpret them
The first confusion arises with the corner labelling. The label is always at the 100% point. But how do you read the axes? If the bottom left corner is W, does W run as 100%-->0% along the bottom axis or 100%-->0% along the left slope of the triangle? Depending on that decision, the other two axes must flip their directions too. It might seem, therefore, that a given point on the graph should also flip if the axes are flipped. But if you select the Flip option you find that although the axes change, any given point on the graph is unchanged. By selecting the TriPoint option you see that the way to read out is almost the same, except that, for example, the horizontal line swaps direction so its value is read from the right-hand axis rather than the left-hand axis. If the axes are labelled along their Edge then there could be confusion so the Flip option is disabled so readout is unambiguous - 100% at the left of the bottom axis.
Because there is no consistency about which phase is at which corner, it's good practice to swap between the variations. There are 6 variations you can try!
By using PDE you will start to get used to reading out any of the countless variations (often inconsistent within a publication!) you will meet.
You can also Magnify the plot to the bottom left-hand corner with whatever is 100% at that corner running from 100-->MinVal and the other two running from 0-->100-MinVal.
Your aim is to try out the different configurations and see if you can work out where different formulations are within the diagram. By turning on and off the TriPoint option so you get used to reading diagrams which don't have a handy readout from your mouse or stylus position.
To illustrate the issues of Phases and Paths through the diagram select the Path and Phase options and input a path and phase as you wish. The Path option requires you to click (point) and drag to create the path, shown by the arrow. The points are shown in terms of ABC which are WSX, SXW etc. depending on your choice of coordinates. If a nasty phase region is on that route then the chances are that you won't get where you want to, so a different route around that phase will be required.
The Phase option allows you to show a phase region as a circle at the given centre values (chosen via a click/tap without moving) with your chosen radius. The values in Phase A etc. show the centre of the phase
To see why the Phase and Paths are so important, go to Paths.
Acknowledgement: The expert input and advice of Seth Lindberg in the development of the phase diagam apps is warmly acknowledged. He is Technology Leader at P&G's Process Technologies - Corporate Engineering Labs in Cincinnati.