Microemulsion Phase Diagram Explorer
Quick Start
HLD-NAC can even gives us phase diagrams. In one app it is possible to see how the oil and water phases behave, as 2-phase or 3-phase systems. This app, based on un-published work by Acosta, was a ground-breaking development. A later, more refined approach from U. Pennsylvania, PennSurf2 is of especial interest to the oil exploration world for which it was developed.
To understand the app you also have to understand ternary phase diagrams. If, like me, you find these difficult, you can get a quick tutorial via the Phase Diagram Explorer app.
Microemulsion PDE
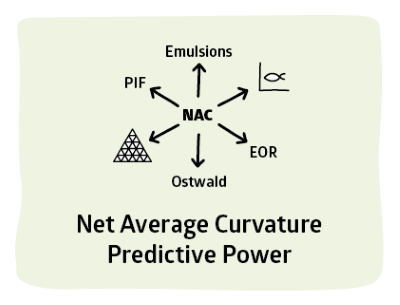 This extension of NAC theory from the Acosta group is a major advance in system predictability via HLD-NAC theory.
The HLD, and later the HLD-NAC, were developed to work with saturated microemulsions systems (i.e. having an excess phase) prepared with oil to water ratios close to 1. However, the net and average curvatures can be used independently of the HLD for systems that are not saturated (no excess phases). The net curvature is simply the area-averaged curvature of the microemulsion drop, and the average curvature is simply the ratio between the area and the volume of the drop. For a non-saturated system that contains a known volume of water, oil, and surfactant, one can use NAC to calculate the real dimensions of the drop. Going through that exercise one realizes that it is not possible to obtain drop-like structures for systems that contain oil/water ratios between 3/1 and 1/3. This mathematical realization makes perfect sense in practice as it has been seen that the HLD predictions are overruled by incompatible oil to water ratios. For example, if you have a formulation with a negative HLD one expects to have oil-in-water microemulsions. However, what happens if your formulation contains 90% oil and only 10% water? The NAC will tell you that you will have no problem in forming drops of water in oil, regardless of what the HLD might say. This page helps you map microemulsion ternary phase diagrams that have been estimated from basic surfactant properties and formulation conditions. The algorithm includes a method that resolves the incompatibilities between HLD and oil/water ratios. This algorithm will be described in detail in upcoming articles.
One of the important variables of this page is the HLD. You will notice that by going from a negative to a positive HLD you will find a shift in the orientation of the tie lines, and at near zero HLD you will notice the formation of a three-phase system. You might notice something interesting as well, if you move the cursor to one side or the other you will find two-phase systems, even though you are at an HLD=0. This has been observed with real formulations and it illustrates what can happen when one deviates from the oil/water ratio of 1 used in most of the literature to describe the phase behaviour of microemulsions.
As you continue to play with the HLD, set a highly negative HLD. Take a look at the height of the top vertex of the 2-phase triangle. The higher that vertex, the less efficient is your formulation, the more surfactant you need to solubilise all the oil in the system. Now move the HLD towards zero and see what happens to that vertex. You can draw your own conclusions, and play with your own formulation conditions (as expressed through the HLD) to reach your desired formulation. Please be mindful that this app does not consider the presence of liquid crystals or precipitate formation. Those alternative phases (not considered by the HLD-NAC) can prevent you from reaching your desired condition.
Another important variable that influences the shape of the ternary phase diagram is the length of the surfactant tail (L). To play with that variable you can set a negative HLD first and take a look at the height of the vertex of that system as you increase the length of the surfactant tail (without changing the HLD) and see what happens. Draw your own conclusions. The length of the surfactant tail can also play a big role when you are near HLD=0. However, it is interesting to see what is the influence of L on the system where HLD is exactly equal to zero.
The MWt is that of the surfactant. As it grows the number of molecules available decrease for a given % surfactant, an effect that becomes obvious as you move the slider.
When the system has an HLD near or exactly zero, the characteristic length, ξ, tends to dominate the shape of the ternary phase diagram. To explore the effect of this variable, set the value of HLD=0, and then change the value of the characteristic length. Remember, the lower the boundaries of the two- or three-phase regions, the less efficient is your formulation at solubilising oil and/or water.
Although the app covers the whole of formulation space, for many systems you would want to look at a range covering a smaller amount of surfactant. Increase the Surf Mag slider to, say, 5 to home in on a smaller region in more detail.
There are some practical benefits of playing with this phase diagram explorer. For example, identifying potential changes in your formulation with changes in temperature, salinity, etc. If you have an ethoxylated nonionic surfactant, for example, increasing your temperature will produce a positive shift in HLD. For ionic surfactants, increasing the temperature will produce a negative shift in the HLD. To explore the effect of temperature, set the HLD of the formulation at 25C, and then change the temperature of the system. Remember to select the appropriate type of surfactant (ionic or nonionic). Please note that the explorer was built using the constants for typical ethoxylated nonionic surfactants or conventional ionic surfactants. Polyhydric nonionic surfactants, extended surfactants, or mixtures of ionic and nonionic surfactants require a different set of parameters.
The MPDE contain two other variables, the water limit (%) and the oil limit (%). These limits are there to reflect the fact that many surfactant-water and surfactant-oil pairs are not fully compatible. For example, entering a water limit of 10% means that the phase which separates out is not 100% water but water with 10% surfactant – commonly called a coacervate The oil limit value has a similar interpretation.