Quick Phase Diagrams
Quick Start
Seth Lindberg has a mini-max philosophy for phase diagrams: minimum work for maximum useful knowledge. Rather than spend 3 months with lots of expensive equipment to uncover details you never need, why not get all you need in 3 days of simple, smart experiments?
You'll quickly find the formulation sweet spots and danger zones - just what you need to solve a formulation challenge.
Seth is Technology Leader at P&G's Process Technologies - Corporate Engineering Labs in Cincinnati and this page is based (with permission) on his extensive knowledge of the measurement and value of surfactant phase diagrams.
What phases do you have?
To get a phase diagram you first need to identify which phase you have in your vial or jar. No need for polarizing microscopes or X-ray scattering. The human eye, some common sense and some sheets of polarizer film are all you need. Just follow the chart.
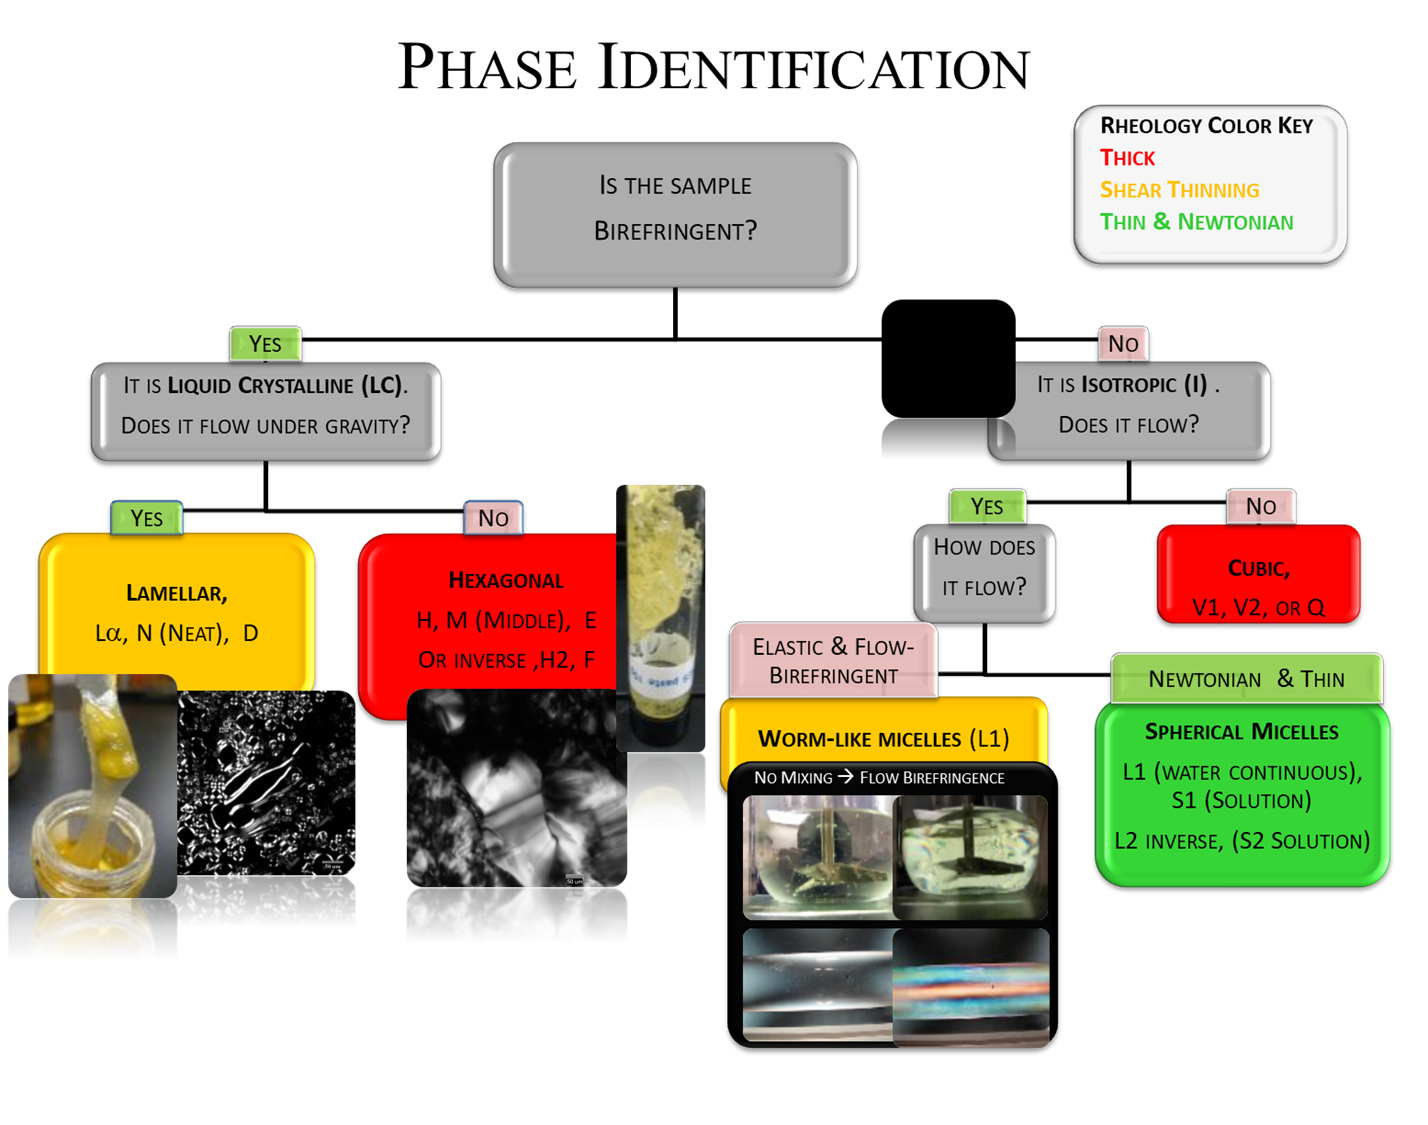 Apart from a trick with "flow birefringence", shown below, you can use this chart to quickly identify a surfactant phase with a good degree of accuracy. Let's go through the chart step by step. Tips and tricks to make this super easy are described later. Don't worry too much about sub-nomenclature. It's more important to know that it's, say, Hexagonal, than to worry about calling it H, M, E, H2 or F. Seth has used a convenient colour coding (the same scheme is used in the Data Viewer apps) And missing from this chart is a rather basic question: "Is it two phases?" in which case you just call it 2 phased!
Is the sample birefringent? Hold the sample between sheets of crossed polarizer. If you just see black, the sample isn't birefringent.
- Yes. So it is Liquid Crystalline. Now check for flow under gravity.
- It flows under gravity. It is Lamellar, called Lα, N (Neat) or D
- It doesn't flow. It is Hexagonal, called H, M (Middle), E or maybe Inverse, H2, F.
- No. So it is Isotropic. Now check whether it flows.
- Yes. OK, so do you see flickering effects between crossed polarizers when you shake or stir it?
- Yes. It's Worm-Like Micelles, L1
- No. It' Spherical Micelles L1 (Water continuous), S (Solution), L2 (oil continuous), S2 (Solution)
- No. It's Cubic, V1, V2 or Q
Helpful tricks
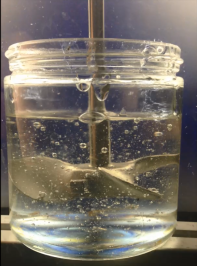
It's important to have a relatively large amount of sample to inspect between crossed polarizers, so at a small scale, scintillation vials work well, and jars are fine for larger scale. In each case you need a wide top to make it easy to add sometimes viscous samples and fill to somewhere between 1/2 and 2/3 full.
Because, for a phase diagram, you need to look at sets of samples, you need two big sheets of polarizer (it's worth spending a little extra to get thick sheets that don't curl too easily) attached to some simple frame, with a nice even light source (modern LED "light pads" are ideal) behind. See the Guide to a polarizer box for more details. You also need to have a camera setup that makes it routine to grab images under the same conditions (so turn off autoexposure!), to make it easy to spot sometimes subtle birefringence effects. It is very much worth the time invested in getting such a setup to be super-easy and reliable.
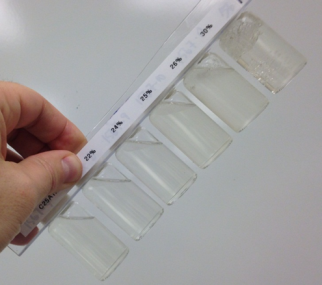 It is very easy to get lost in phase diagram space. So make some simple sample holders that ensure your samples are always held in the right order and have their sample numbers clearly visible.
A great trick is to get a plastic corner bracket, 15-30cm long with, say, 3-5 cm wide edges. Drill a series of holes the diameter of the glass screw top. Now you can slide each tube through the hole then screw the cap firmly in place. You can place a label on the right-angled strip above. Now you can carry the samples safely around the lab, get good (self-documenting) photos and do the "tilt" and "bang" experiments described next.
A series of scans
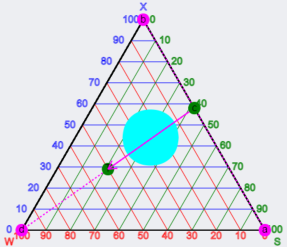 Suppose you are concerned about a possible viscous cubic or hexagonal phase that might mess up your ability to take a concentrated solution and dilute it easily. The image is from the Paths app, and shows the danger zone as the circle in the middle of the diagram. You don't need to know everything about the phase diagram of this system, you just want to know where the safe and unsafe regions are. So set up a small series of scans starting at, say, 20, 40 and 60 on the right, with paths that are parallel to the 40-->0/100 shown in the diagram. With a bit of arithmetic you can work out the compositions required for each tube. Let's say you wanted 6 vials in each scan. So that's 18 tubes - not too difficult to arrange.
You make up the formulations and get them into the tubes, nicely held in their sample holders and neatly labelled. Now you need to get your data. Again, you have to ask a zeroth question "Is it 2 phases", but that's rather obvious.
 First question. Are they birefringent? A photo between crossed polarizers will quickly confirm those that are obviously birefringent.
But the worm-like micelles don't show up at all - till you give them a sharp "tap". Just lift the vial holder, and take a photo (or, better, a short video) as you bring it down to hit the surface. Any glimpse of light tells you that there is flow birefringence.
More dramatic is to stir the sample. Move your mouse over the image and you see how it changes with the stirrer off to stirrer on!
Second question. Are they viscous? Of course you could get your rheometer and measure them, but that's too much work. Instead you hold your tubes at 45° and, after a while, take a picture. Sure, some of them are more viscous than others, and the simple picture can't capture that. But all we want to know is "Does it flow or not?" Most of the time the answer is obvious. But sometimes it's not. That's fine. Decide that "Doesn't flow after 15s" is your definition. Give each tube a score. Carry on with the rest of the scans. Then plot your scores into some convenient graphics. Does it make a sensible phase diagram? Yes, great. No, well, go back to those confusing tubes and use 5s or 50s as a definition. Keep it simple. Very quickly you'll sort things out.
Plotting the diagram
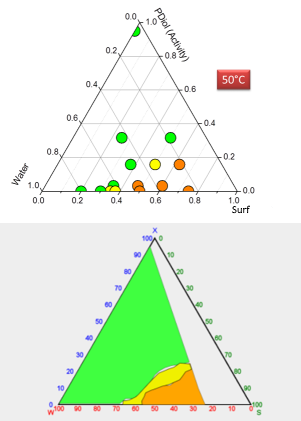 In our example, you have data on 18 tubes, covering maybe 30% of phase diagram space. How can you "draw a phase diagram"? Well, let's look at a real example from Seth. For this real-world example he needed to know what was going on in a formulation zone of interest to his application. There are about 15 datapoints, with one taken right near the top as an extra check once he had a rough diagram. Using his clever colour coding (see the colours in his chart), we see that near the bottom it's Lα, (Obviously birefringent, flowed OK), for most of the space (OK, he's guessing, but the top datapoint sort of confirms this) it's L1 (non-birefringent, flows). But clearly there is a 2-phase area. Are there enough datapoints to define it exactly? Probably not. Do we care? If it's super important then we care - in which case we know where we need to set up a few more tubes, and if we don't then we're fine. By putting those points into the format of the Ternary Data Viewer the phase diagram itself is then shown. Sure, there's a chunk missing. Again, if we care we get a few more datapoints, and if we don't, why do the work.