CMC and Γ
Quick Start
I'm proud to say that this app has been used in an academic paper1 which talks of the "Abbott method". This is because the focus is not on the relatively boring CMC (test the plot with the Linear Concentration option turned on to see what I mean) but what the isotherm (change of surface tension, γ, with concentration) tells us about the surfactant behaviour much, much earlier in the curve when most of the interesting stuff happens.
CMC and Γ
 There are two things people know about their surfactant: its critical micelle concentration, CMC, and its surface tension γc at concentrations above the CMC. These are supposed to have a dramatic effect on foaming properties, along with two other key properties, Γ, the surface "excess" concentration ("excess" is used technically and can safely be ignored) and A the head area. Γ can be found from the slope of the simple measurement of γ v surfactant concentration. That slope tends to be a constant, Γm once γ has decreased by 20mN/m from the starting value of pure water. This allows us to produce a simple view of how the four properties inter-relate using the sliders for the two given properties. Two other properties are described below.
Not so significant
It is "obvious" from the classic log-plot that the CMC is an exciting point of dramatic changes - that's why it is supposed to be so significant. But if you select the Linear option you find that nothing much is happening near the CMC. The reason for this is described in an excellent pair of images below.
The curve is a simplified Langmuir-Szyszkowski plot. Since September 2018 the app has been updated thanks to insights from surfactant expert Sanja Natali. She pointed out that the simplified version tended to give head areas lower than typical values and recommended that Γm should be based not on CMC/10 but on the concentration that gives a surface tension of 52mN/m (which is a key reference state in the equation). You will find that this makes a significant difference. If you don't know what value to use, choose CMC/10 (or CMC/12). If you accidentally set it to greater than CMC/2 (which is implausible) then it is automatically reduced to CMC/10. If you want to explore basic CMC effects, select the "Use CMC/10" or "Use CMC/12" option.
`γ=γ_0-RT.Γ_mln(1+K.c)`
Γm is the maximum value of the surface excess, but the m is conventionally said to stand for "monolayer". K is the adsorption coefficient. Other versions of Langmuir use a which is 1/K - the choice is yours. From K and from c at the CMC it is possible to calculate a theoretical elasticity, E, of the interface:
`E=RT.Γ_m.K.c`
The theoretical elasticity is often 1-2 orders of magnitude too large. That is because "holes" opened by stretching the interface can be rapidly filled by surfactant molecules from the bulk. The measured elasticity depends, therefore, on the speed of the measurement and the theoretical E is for an infinitely fast measurement.
In reality Γm is obtained by fitting the data from a real experiment measuring surface tension v. surfactant concentration.
Γm is used to calculate the surfactant head area, A via Avogadro's number N:
`A=1/(NΓ_m)`
I considered adding a "mixed Γ" option which produces curves for mixtures of primary and secondary surfactants. But I decided against it because outside the academic lab it's probably more work to get the key parameters for the model than it is to measure the curve of your mixtures directly. Mixed surfactants are hugely important, but the formulae for describing them don't usually, as far as I can tell, lead to great practical enlightenment.
What may seem surprising is that Γm does not depend on CMC but, in this model, only on γc. This is indeed a simplification but Γm does not change strongly between surfactants. What is crucial is how quickly a high Γ value is reached which is governed by the CMC (for a single surfactant) and by partition effects (e.g. when lauric acid is added to an SLES/CAPB foaming system).
 Saturated surface
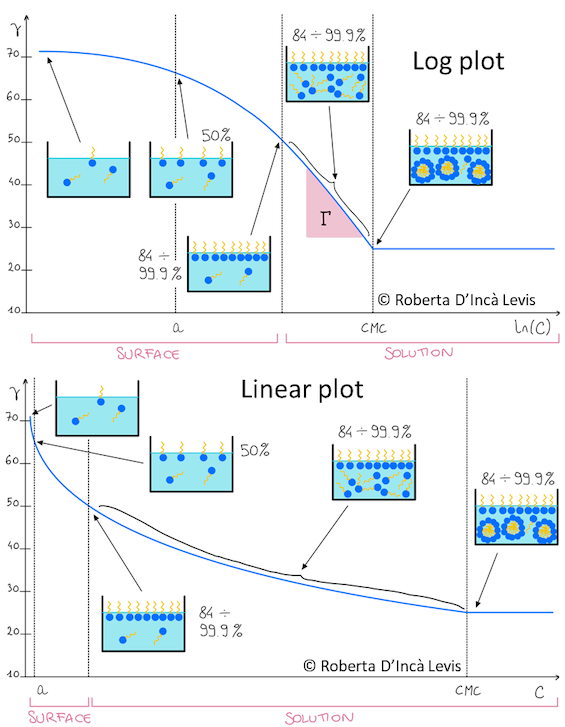
It is a common myth that the surface gets saturated at the CMC. In reality, as you saw when selecting the Linear option in the app, most of the action at the surface takes place long before the CMC.
This pair of images, courtesy of Roberta D’Incà Levis, shows how the surface gets packed early on. Having both the Log and Linear views at the same time show how easy it is to get confused by the Log plot.
The CMC is a phenomenon of the internal system (you can measure CMCs in closed vessels using, say, conductivity) so is not connected to the surface saturation.
You can see this in the images: molecules sitting in the solution get steadily more concentrated, independent of what's happening on the surface, till you get micelles at the CMC. Those concentrated clumps are often referred to as "premicelles".
It is often said that a picture is worth 1000 words. I am grateful to Roberta for having put these tricky ideas of surface saturation into images that convey so much. Note that you can even see (in the Log plot) where Γ comes from!
1Théophile Gaudin, Patricia Rotureau, Isabelle Pezron, Guillaume Fayet, Investigating the impact of sugar-based surfactants structure on surface tension at critical micelle concentration with structure-property relationships, Journal of Colloid and Interface Science, 516, 2018, 162-171